How to advance your CS team’s AI maturity (and why it could improve your NRR)
Image File
Original HTML

Quick summary: NRR remained flat for SaaS companies in recent years but mature AI teams are performing at a higher level. Here is what the 2026 Customer Success Leadership Study reveals about AI and NRR correlation, and how to develop your CS team’s AI maturity.

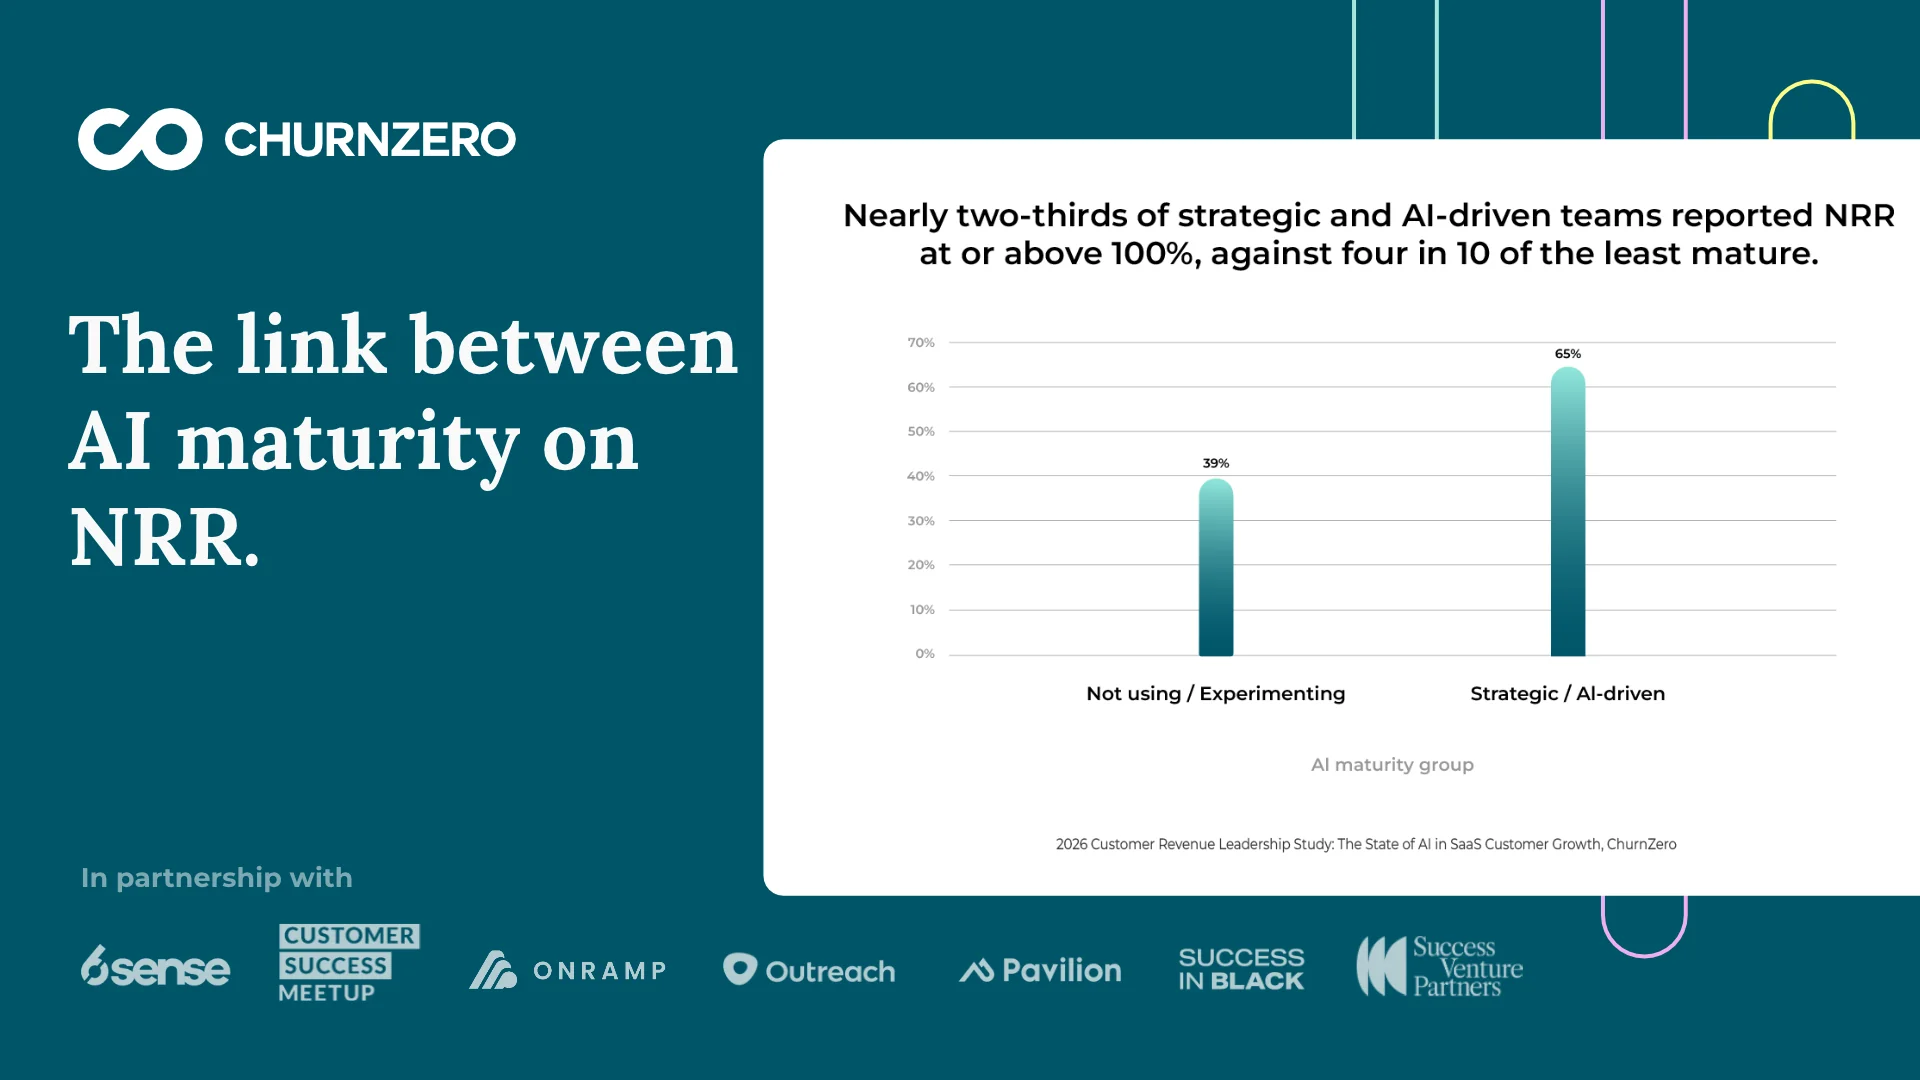
NRR has plateaued for SaaS organizations for the last three years, with reported numbers remaining flat from 2024 through 2026. But teams that are ahead on AI maturity tend to perform better. The majority of mature AI businesses report NRR of 100% or higher, while tactical AI teams are not as likely to perform at that level.

ChurnZero’s 2026 Customer Success Leadership Study polled nearly 600 CS and revenue leaders to learn about the current state of AI in SaaS. The numbers clearly show a correlation between mature AI and stronger NRR.

There are many possible explanations for why businesses with more developed, strategic AI tend to see higher NRR. But one thing is clear: developing AI for strategic customer success can enable your team to drive growth more efficiently.

NRR and AI maturity, by the numbers.

The study’s responses from CS and revenue leaders about AI maturity and NRR showed a clear trend:

- NRR has remained flat from 2024 to 2026

- ChurnZero compared how many teams report NRR of 100% or higher by AI maturity: 

- Nearly two-thirds (65%) of strategic and AI-driven teams reported NRR of 100% or higher

- 39% of the least mature AI teams reported NRR of 100% or higher

This tells us that mature AI teams are much more likely to have a NRR of 100% or higher than teams that are further behind on AI use.

How to evolve your AI and enable customer success.

For CS teams, building more advanced AI usage can help CSMs drive growth and retention, the components of NRR. Here are some ways to grow your AI beyond tactical use and help your team mature strategically.

Redirect resources toward high-impact work.

For many teams, AI can take over tedious tasks like building presentations from scratch, writing emails from templates, and summarizing meeting notes. Now you can direct your CSMs toward more high-impact work that drives growth – checking in with customers, reviewing accounts for buying opportunities, or managing a larger book of business. Find out how much time your CSMs are saving with AI, and use that time wisely.

Train your CSMs for strategic work.

When you hand over administrative work to AI, CSMs can focus on more challenging, long-term value tasks: negotiating expansions, saving at-risk accounts, escalating issues, and growing the partnership between your business and the customer. Make sure to keep developing your team’s skills through training. For example, your CSMs should have the contextual understanding to identify customer pain points and the sales skills to promote renewals and expansions at the right time.

Let AI drive customer retention and growth.

If you’re already using AI to automate manual tasks, you can now look at ways it can help grow the business. For example, many CSPs now have signal detection AI agents that can evaluate customer data, flagging accounts you’re at risk of losing and identifying opportunities for expansion. CSMs can then direct more of their attention toward saving at-risk accounts and growing ones that are ready to buy.

Start measuring AI impact.

Even though most CS teams use AI, they often can’t measure its performance – according to the study, 63% of CS leaders have no consistent method to track AI impact. But if you don’t know how AI is affecting your team, you can’t strategically improve your processes and you may still rely on manual human interventions at every step (the study found that teams that don’t measure AI are four times more likely to require human approval for every recommendation).

List out the tasks you’re using AI to automate, and define the metric that determines success. Note how your team was performing before automation, then start tracking that metric and check in on a regular basis to see how your team is performing with AI. Now you have a framework to measure other AI workflows and automations as you go along. Eventually, you’ll be able to identify where it makes sense to invest more resources in AI automations.

Mature AI teams tend to see better NRR performance.

AI-leading organizations may have other factors driving better NRR performance, such as stronger data, advanced products and services, or better-funded CS teams with more resources. But the correlation is clear: while NRR has stayed flat across the industry, AI leaders are more likely to report NRR of 100% or higher.

To start closing that gap, reallocate the time that AI saves your CSMs toward work that drives retention and expansion. Let AI flag risks and buying signals, while training your team for strategic customer-facing work and measuring results so you can show the impact.

Class (B2B/B2C)
B2B
Ingest Status
Rewritten
Dedupe hash
63ddec7dcd7ffee9f4ba86857f9eed73
Press Eligible
Yes
Press Eligible Reason
Manuelle Prüfung nötig. Risiko: MEDIUM. Flags: ['numbers']. Stichprobe: False
Source Name
ChurnZero
Original Summary

<p>NRR remained flat for SaaS companies in recent years but mature AI teams are performing at a higher level. Here is what the 2026 Customer Success Leadership Study reveals about AI and NRR correlation, and how to develop your CS team’s AI maturity. </p>
<p>The post <a href="https://churnzero.com/blog/how-to-advance-your-cs-teams-ai-maturity-and… to advance your CS team’s AI maturity (and why it could improve your NRR)</a> appeared first on <a href="https://churnzero.com">ChurnZero</a>.</p&gt;

Image URL
https://churnzero.com/wp-content/uploads/2026/10/Promo-materials-2026-Customer-Revenue-Leadership-Study-2.png
Content Hash (SHA-256, erste 32 hex)
60e36230ac67dc1d6e745887307c5fd6
The AI paradox: CS teams are saving time but NRR isn’t budging.
Image File
Original HTML

Quick summary: Most CS teams now offload admin work to AI, but the time saved isn’t translating to better NRR. To drive growth, teams need to measure time saved, devote more time to growth activities, and gradually build AI trust.

The large majority of CS teams are primarily using AI to automate manual tasks and save time for CSMs. In theory, reducing the administrative workload should free up more bandwidth for CSMs to focus on work that drives NRR. But in reality, NRR hasn’t improved for the SaaS industry in the last three years.

ChurnZero polled almost 580 CS leaders for the 2026 Customer Success Leadership Study to learn how they’re currently using AI, and confirmed that time savings isn’t driving NRR. To make a bigger impact, CS teams may need to move beyond the tactical and start thinking strategically about how AI can help them drive NRR performance.

The trends: AI time savings vs. NRR stagnation.

The study showed that CS leaders are automating manual tasks with AI, but NRR remains unaffected:

- 81% of leaders say AI reduces the time spent on manual tasks like logging tasks, summarizing leads and calls, and doing account research

- NRR remained flat from 2024 through 2026, which suggests that AI has not moved the needle

Why time saved doesn’t automatically increase NRR.

Saving CSMs time on manual, repetitive tasks may not automatically result in better NRR for a number of reasons:

- Saved time isn’t being redirected: If you aren’t reallocating rescued time or resources back toward activities that drive NRR, you might not see a meaningful change.

- AI maturity: While NRR remains flat industry-wide, AI maturity correlates to higher NRR. When ChurnZero compared the AI maturity of teams that report NRR of 100% or higher, the results were clear:

- Nearly two-thirds (64.6%) of strategic, AI-driven teams reported NRR of 100% or higher

- Only 39.4% of underdeveloped AI teams reported NRR of 100% or higher

- Teams are still in the experimental phase: According to the study, 19% of leaders put AI maturity at the experimental phase, and 32% at the tactical phase (with AI used in limited cases). When teams are still playing around with AI capabilities, they may still be distracted from their day-to-day work – and they may end up building redundant tools or workflows that end up abandoned.

- Low trust in AI: Four in 10 teams still require human approval at every step. This can create a bottleneck because teams still need to review and approve AI output, even when they’re saving time on administrative work.

How to close the gap between AI time savings and NRR performance.

Saving time for CSMs is a worthwhile goal, but it won’t automatically improve your team’s performance. Start using AI strategically so your CSMs can focus on work that impacts revenue.

Determine how much time you’re actually saving

CS teams say they’re saving time on manual tasks, but most teams have no reliable way to report on AI performance – 63% of CS leaders say they have no method to measure AI impact. This means teams can’t say how AI is improving their work, or show how it’s making a difference at all. And if you can’t tie AI to team outcomes, you certainly can’t show how it’s affecting NRR.

If you want to show the impact that AI is having (and redirect it toward NRR-focused activities), start measuring what AI does for you.

- Take inventory of AI workflows: Make a list of all the current administrative tasks that AI manages for your team, or identify the workflows that you’re about to automate.

- Write down the benchmark: Find out how much time each administrative task takes for a CSM without AI assistance. Make sure to look at specific time-sinks, like QBR preparation or call summaries.

- Record AI performance. Start tracking how much time each administrative task takes AI to perform. Check in on those numbers on a quarterly basis.

- Find out how much time you’ve saved. Now you can see how much time your CSMs are getting back on a daily, weekly, or monthly basis. This can help you determine how much time you have to redirect toward more impactful work.

Refocus your team on work that drives NRR

For many CS teams, leaders should focus on reallocating time and resources toward activities that drive retention and expansion. If CSMs are gaining more bandwidth in their day, they should be able to assume a greater role in driving the success of the team:

- Managing larger customer portfolios: With less time spent researching accounts, preparing for meetings, or building presentations, CSMs could potentially manage a larger book of customers. Be careful when rebalancing portfolios, however — you don’t want your CSMs to risk their customers by biting off more than they can chew.

- Booking expansion calls: Your CSMs devote more time to researching accounts and identifying expansion opportunities, then scheduling calls with the customer. With more advanced tools, you can even have AI automatically review accounts and surface buying opportunities directly to the CSM, who can then focus on selling the expansion.

- Career development: Make sure your team is consistently developing their skills through training, collaboration, and career progression. You want CSMs with the ability to handle challenging, high-value tasks like negotiating new deals, saving at-risk accounts, and developing partnerships with the customer.

Build AI trust over time.

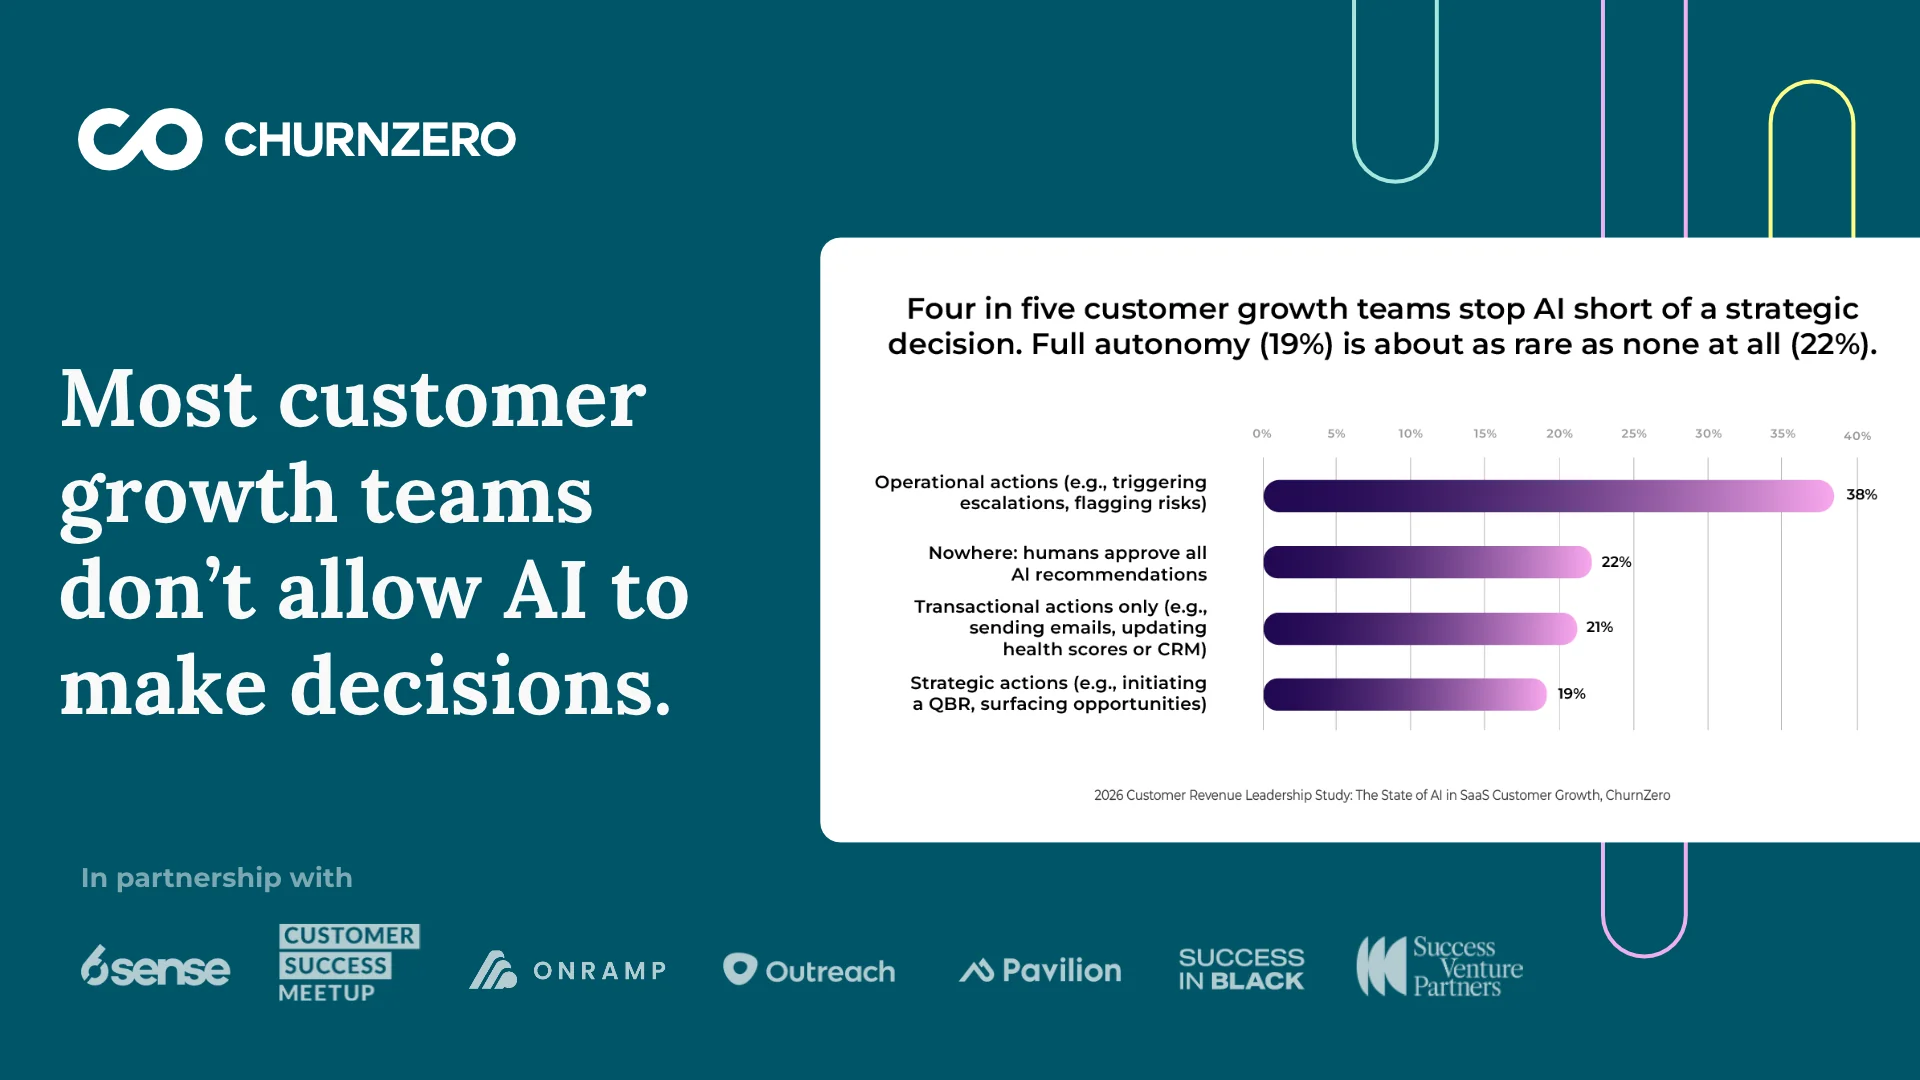
CS teams don’t start out with a lot of trust in AI – possibly because they have no method for measuring it. Four out of five teams stop AI before it makes any strategic decisions, and nearly four in ten teams still require human intervention at every step. To advance AI maturity (which correlates with higher NRR), teams can develop trust in AI and let it handle more high-value tasks over time.

When automating CS workflows, teams should start by including a human who signs off on AI actions, messages, or recommendations – ChurnZero CEO You Mon Tsang recommended this approach in a recent episode of the Startup Builders & Backers podcast. Once leaders are more comfortable with AI autonomy, they can gradually shift toward full automation. This doesn’t need to be an all-or-nothing proposition, and can follow a natural progression over time.

Time saved for CSMs should be used for retention and expansion.

While 81% of CS teams use AI to automate administrative work, NRR remains flat – it’s a reasonable deduction that saving time is only half the battle. Clawing back hours in your day only makes a difference if you use them for growth activities. By measuring AI impact, reallocating time toward retention and expansion, and building AI trust incrementally, leaders can turn AI time savings into a tool for revenue expansion.

Class (B2B/B2C)
B2B
Ingest Status
Rewritten
Dedupe hash
53c14e6cb1165662084c3ef59d188add
Press Eligible
Yes
Press Eligible Reason
Manuelle Prüfung nötig. Risiko: MEDIUM. Flags: ['numbers']. Stichprobe: False
Source Name
ChurnZero
Original Summary

<p>Most CS teams now offload admin work to AI, but the time saved isn’t translating to better NRR. To drive growth, teams need to measure time saved, devote more time to growth activities, and gradually build AI trust. </p>
<p>The post <a href="https://churnzero.com/blog/ai-time-savings-nrr/">The AI paradox: CS teams are saving time but NRR isn’t budging.</a> appeared first on <a href="https://churnzero.com">ChurnZero</a>.</p&gt;

Image URL
https://churnzero.com/wp-content/uploads/2026/10/Promo-materials-2026-Customer-Revenue-Leadership-Study-3.png
Content Hash (SHA-256, erste 32 hex)
f06c43c18878054fbc9a6904dae73f44
Sales teams outpace CS on AI adoption and measurement.
Image File
Original HTML

Quick summary: Sales teams lead ahead of CS when it comes to using AI and quantifying its performance. CS leaders are under pressure to adopt AI, and they can use sales as a blueprint for AI implementations that deliver measurable, impactful results.

Sales departments are outpacing customer success teams on AI adoption and measurement. They’re more likely to turn to AI first when solving problems, they track performance more consistently, and they can often connect AI to revenue outcomes when CS can’t.

ChurnZero’s 2026 Customer Success Leadership Study surveyed 580 CS and revenue leaders to find out how they’re using AI, and the results clearly show the gap between sales and CS. Leaders should take note because the mandate to adopt AI is growing stronger: according to a recent Gartner Survey, 91% of customer success and support leaders are under pressure to implement AI.

The upside is that CS teams can catch up to what sales is already doing. By automating the right workflows, measuring results from the start, and using CSP-embedded AI tools, CS teams can run more efficiently and make a bigger impact on revenue.

Sales AI adoption vs. CS AI adoption by the numbers:

- Nearly half (48%) of sales teams turn to AI first to solve a problem, compared to 32% of CS teams.

- More than half (57%) of sales leaders can tie AI to revenue outcomes, compared to less than one-quarter (21%) of CS leaders. 

- CS leaders also lag behind sales leaders in measuring AI by functions, including time saved and team efficiency.

- Only 20% of sales leaders have no consistent method to measure AI success, compared to 63% of CS leaders.

“CS is generally tracking behind sales in tech adoption, and, [to be honest], I think that will always be true. Whatever sales is doing now is what customer success will be doing in 12-24 months.” – YouMon Tsang, CEO and Co-founder, ChurnZero

How CS teams can close the gap with sales on AI adoption

When CS leaders feel pressured to adopt AI, they risk automating too many processes too quickly, without a clear strategy or any way to measure the results. Use these strategies to deploy AI to your team without losing the value your CSMs bring to the table:

Roll out AI workflows that matter

Start working on AI-automated workflows that actually make a difference for your team:

- Begin with administrative tasks: If you’re just getting started with AI, prioritize the automation of simple, repetitive tasks that eat up your team’s bandwidth. This could include building QBRs, researching account activity, or writing emails.

- Play around with AI prompts: Don’t roll out AI automations across the department without testing them first. Experiment with prompts a little bit at a time, keeping the ones that work well and piloting them with small customer segments.

- Leave relationship-building to the humans: With less time spent on manual work, your CSMs can focus on building relationships with their customers, which AI can’t currently replicate.

Start measuring AI performance

Most CS teams can’t measure AI performance at all, but you need to show results if you want AI in your budget:

- Define what AI success means: Figure out how you will measure AI impact. Meet with sales leaders to find out what they’re tracking. Look at the workflows you’re automating and determine the metrics that show how AI changed them. Consider how you’d defend your AI spending when it comes time to submit your departmental budget.

- Put AI in your budget: Identify what you’re spending on AI and separate it from your general technology spend. This creates greater accountability because you may be asked to defend the expense in the future.

- Tie AI to revenue: CS lags far behind in pegging AI to revenue outcomes. You should be defending revenue-related AI activities by their impact on renewals, expansion, and any other team responsibilities that drive NRR.

Use AI tools embedded in your CSP

Rolling out AI to your CS team may not require as much testing and development time as you think. ChurnZero offers native AI tools and agents that can help your teams automate tasks, increase personalization, and find risk and opportunities faster.

CSPs reside in 45% of tech stacks, but 62% of teams that have one name it as one of the top three tools for growing customer revenue. You may already have a number of AI resources at your disposal right in your CSP, including:

- AI agents that automate manual tasks, summarize activities, and identify churn risks or expansion opportunities.

- Intelligent reporting on customer data that provides fast and consistent access to relevant account insights.

- AI assistants that support CS tasks across the entire customer book, from writing and analysis to recommendations and customer service.

CS teams should prioritize AI adoption and measurement

Sales may be leading on AI adoption and measurement, but CS teams don’t have to get left in the dust. With 91% of CS leaders under pressure to adopt AI, teams should replicate many of the same strategies sales is already using to show AI results.

Closing the gap starts with automating repetitive administrative tasks. CS teams should measure performance from the start by tying AI to metrics like time saved, renewals, and expansion. And you don’t need to build everything from scratch — many CSPs now provide native, embedded tools that make it easier to scale AI adoption. With these strategies, CS teams can turn AI into a revenue driver.

Class (B2B/B2C)
B2B
Ingest Status
Rewritten
Dedupe hash
cdc2787579650d22301dbcfcf8a89e50
Press Eligible
Yes
Press Eligible Reason
Manuelle Prüfung nötig. Risiko: MEDIUM. Flags: ['numbers']. Stichprobe: False
Source Name
ChurnZero
Original Summary

<p>Sales teams lead ahead of CS when it comes to using AI and quantifying its performance. CS leaders are under pressure to adopt AI, and they can use sales as a blueprint for AI implementations that deliver measurable, impactful results. </p>
<p>The post <a href="https://churnzero.com/blog/sales-outpace-cs-ai-adoption/">Sales teams outpace CS on AI adoption and measurement.</a> appeared first on <a href="https://churnzero.com">ChurnZero</a>.</p&gt;

Image URL
https://churnzero.com/wp-content/uploads/2026/10/blog-photos-9-1024x576.png
Content Hash (SHA-256, erste 32 hex)
3a797dece8758c50f3844ee67efcf5ae
Interim report third quarter 2026
Image File
Original HTML

Interim report third quarter 2026

- Order intake SEK 36,948 million (30,769)

- Order intake, at fixed exchange rates, increased by 17%, and organically by 17%

- Revenues SEK 37,728 million (29,218)

- Revenue growth, at fixed exchange rates, increased by 26%, and organically by 25%

- Adjusted EBITA SEK 8,477 million (5,539)

- Adjusted EBITA margin 22.5% (19.0)

- Adjusted EBIT SEK 7,997 million (5,103)

- Adjusted EBIT margin 21.2% (17.5)

- Adjusted profit before tax SEK 7,693 million (4,707)

- Profit for the period SEK 5,772 million (3,538)

- Adjusted profit for the period SEK 5,820 million (3,530)

- Earnings per share, diluted SEK 4.60 (2.82)

- Adjusted earnings per share, diluted SEK 4.64 (2.81)

- Free operating cash flow SEK 7,167 million (5,603)

Additional information may be obtained from Sandvik Investor Relations, phone +46 70 782 63 74 (Louise Tjeder).

A webcast and conference call will be held on October 22, 2026, at 10:00 AM CEST. Information is available at home.sandvik/investors

Stockholm, October 22, 2026

Sandvik Aktiebolag (publ)

Stefan Widing

President and CEO

This information is information that Sandvik AB is obliged to make public pursuant to the EU Market Abuse Regulation. The information was submitted for publication, through the agency of the contact person set out above, at about 08:00 AM CEST on October 22, 2026.

Interim report third quarter 2026 (PDF)

Class (B2B/B2C)
B2B
Ingest Status
Rewritten
Dedupe hash
3ac12b5b612214c55ab68610ba1f1988
Press Eligible
Yes
Press Eligible Reason
Manuelle Prüfung nötig. Risiko: MEDIUM. Flags: ['finance', 'numbers']. Stichprobe: False
Source Name
Sandvik Newsroom
Original Summary

Strong revenue growth and profit margin

Image URL
https://www.home.sandvik/cdn-cgi/image/w=1200,h=630,quality=90,fit=cover,format=avif/contentassets/8ab126e3464d4aaf8a2246d00c89b4fe/sandvik_og.jpg?v=1789038534
Source Node
Content Hash (SHA-256, erste 32 hex)
0828135f04d5d4c91b571ef3631e7661
Industrial Silver Demand: How Solar, EVs and AI Are Reshaping the Market
Image File
Original HTML

Silver has always had two identities. It is a precious metal held in bars, coins and investment products, but it is also a working material found inside switches, circuit boards, solar cells, vehicles and industrial equipment.

The industrial side now accounts for more than half of annual silver demand, yet the story is becoming less straightforward. Solar manufacturing remains a major consumer, although manufacturers are using less silver per unit of capacity. Vehicle electrification is pulling demand in the other direction, while AI and data-centre expansion are creating a newer source of electronics demand that is clearly growing but still difficult to measure precisely.

Understanding industrial silver demand therefore means looking beyond a single headline number. The mix of demand is changing, and the technologies behind it are changing too.

Key Takeaways

- Industrial fabrication used 657.4 million ounces of silver in 2025, according to the World Silver Survey 2026. It was still the largest broad component of global silver demand despite falling 3% from 2024.

- Metals Focus forecasts industrial demand of 639.6 million ounces in 2026, another decline of roughly 3%.

- Photovoltaics are responsible for much of the current weakness. Solar installations continue to expand, but manufacturers are reducing silver loadings through thrifting and substitution.

- Automotive silver demand is moving in the opposite direction. Oxford Economics forecasts growth of about 3.4% a year from 2025 to 2031.

- AI and data centres should support future electronics demand, although current research does not provide reliable enough silver-loading data to assign them a precise share of the market.

What Is Silver Used For?

Silver is useful in industry for reasons that are difficult to reproduce with cheaper materials. It has the highest electrical conductivity of any metallic element and performs extremely well as a thermal conductor. It also resists oxidation at electrical contact points, which helps explain its use in components that need to work reliably over long periods.

The industrial uses of silver are surprisingly wide. Electrical contacts, printed circuits, switches, solar cells, vehicle electronics, power-management systems, brazing alloys and industrial catalysts all use the metal in one form or another. Silver compounds also have selected medical and antimicrobial applications.

The amount used in a single product is often tiny. That can make industrial demand easy to underestimate until those small quantities are multiplied across millions of vehicles, hundreds of gigawatts of solar capacity and enormous volumes of electronic equipment.

The scale became especially clear over the first half of this decade. Industrial silver demand reached a record 680.5 million ounces in 2024, then eased to 657.4 million ounces in 2025. The World Silver Survey 2026 attributes much of that reversal not to a collapse in electrification or electronics, but to changing silver use within the solar industry.

Industrial Silver Demand Has Started to Change Shape

The 2026 forecast looks unusual at first glance. Investment in grids, electric vehicles, computing infrastructure and AI continues, yet total industrial silver demand is expected to decline.

Metals Focus forecasts 639.6 million ounces of industrial demand in 2026, compared with 657.4 million ounces in 2025. North American demand is expected to rise, while declines in East Asia, South Asia and Europe pull down the global figure.

The explanation lies largely inside the electrical and electronics category. Automotive use, grid investment and AI-related electronics remain supportive, but those gains are not expected to offset the contraction in photovoltaic demand.

That difference between the total and its individual components is important. Industrial silver demand is not moving as one block. One large application is becoming less silver-intensive just as other applications are becoming more important.

Silver in Solar Panels: Why More Panels Do Not Mean More Silver

Photovoltaic manufacturing has been one of the biggest changes in the silver market over the past decade.

Silver paste is printed onto solar cells to create conductive pathways. When the cell generates an electrical current, those pathways collect and carry it. Silver is particularly effective in the role because high conductivity helps reduce electrical losses.

The growth was rapid. Photovoltaic silver demand reached a record 197.6 million ounces in 2024, and PV represented about 29% of total industrial silver demand that year. A decade earlier, its share had been about 11%.

What happens next is more complicated.

Solar manufacturers have every reason to reduce the amount of silver they use. When silver becomes more expensive, the incentive becomes stronger. Cell makers have narrowed conductive lines, improved metallization and experimented with partial replacement by copper and other materials.

This process is generally known as silver thrifting.

The effect is already visible. The Silver Institute says photovoltaic installations are more than ten times higher than they were a decade ago, while silver demand from PV is only around three times higher. In other words, solar deployment and silver consumption have stopped moving at the same rate.

The World Silver Survey 2026 expects the divergence to continue. Solar installations may keep rising while silver consumption by the sector falls because the reduction in silver used per cell outweighs growth in the number of cells produced.

That is a much more useful way to think about silver in solar panels than using a fixed “grams per panel” figure.

How Much Silver Is in a Solar Panel?

There is no reliable universal number.

Different manufacturers use different cell technologies and metallization designs, while silver loadings are changing quickly. A figure quoted for one panel generation can become misleading when applied to another.

For market analysis, silver demand per unit of solar capacity is more useful than silver per individual panel. The direction is clear even without forcing a single number onto the market: silver intensity is falling.

That does not make silver irrelevant to solar. It means the industry is learning to produce more solar capacity from each ounce it consumes.

Silver in Electric Vehicles: Automotive Demand Is Taking a Different Path

The automotive silver story has less drama than solar, but its direction is easier to read.

Cars already contain silver in switches, electronic control units, safety systems, infotainment, electrical contacts and other components. Electrification adds battery-management systems, more sophisticated power electronics and a growing network of charging infrastructure.

Battery-electric vehicles generally use more silver than conventional vehicles. Oxford Economics, in research published by the Silver Institute, puts typical battery-EV silver use at approximately 25 to 50 grams per vehicle and estimates that EVs consume roughly 67% to 79% more silver than internal-combustion vehicles on average.

The same research forecasts global automotive silver demand to increase at a 3.4% compound annual rate between 2025 and 2031, reaching about 94 million ounces by 2031. EVs are expected to overtake internal-combustion vehicles as the largest source of automotive silver demand by 2027 and account for 59% of the sector by 2031.

Those are forecasts rather than guarantees. EV adoption rates, vehicle design and the amount of silver used in individual components can all change.

Still, automotive demand differs from the current PV story in one important respect. Vehicle electrification is adding electrical complexity, while solar manufacturing is working aggressively to remove silver from each unit of output.

AI and Data Centres: Real Demand, Less Reliable Numbers

AI has become one of the most frequently repeated parts of the silver investment story, and also one of the easiest to overstate.

The connection itself is credible. AI requires data centres filled with servers, processors, networking equipment and power-management systems. Those facilities also need switchgear, electrical connections, backup power and increasingly large amounts of grid infrastructure. Silver is present in many of the electronic and electrical components involved.

The scale of computing infrastructure is rising quickly. Oxford Economics estimates that global IT power capacity increased from approximately 0.93 gigawatts in 2000 to nearly 50 gigawatts in 2025. AI is adding to that demand for processing capacity.

What cannot yet be stated with the same confidence is exactly how much silver a data centre consumes.

The Silver Institute’s technology research explicitly notes the absence of precise silver-loading data for data centres. That makes estimates assigning AI or data centres a fixed percentage of global silver demand much less robust than figures for established sectors such as automotive or photovoltaics.

A careful interpretation is therefore more useful than an eye-catching percentage. AI and data centres are likely to increase demand for silver-bearing electronics and power equipment, but the scale of the effect still has to be inferred from hardware and infrastructure growth rather than measured directly in ounces.

That distinction matters if the aim is to understand the market rather than simply build a bullish narrative around it.

Why Does Industrial Silver Demand Matter to Investors?

Silver does not trade like a purely industrial commodity. Investment demand, jewellery, mine supply, recycling, inventories, interest rates and broader precious-metals sentiment all influence the market.

Industrial demand nevertheless carries unusual weight because of its size. In 2025 it accounted for well over half of total silver demand, which was approximately 1.13 billion ounces. A material change in industrial consumption can therefore alter the wider supply-demand balance.

Class (B2B/B2C)
B2B
Ingest Status
Rewritten
Dedupe hash
ff630b7c1dda056a76b66815085d9d12
Press Eligible
Yes
Press Eligible Reason
Manuelle Prüfung nötig. Risiko: MEDIUM. Flags: ['numbers']. Stichprobe: False
Source Name
Rio Silver, Inc.
Original Summary

<p>Silver has always had two identities. It is a precious metal held in bars, coins and investment products, but it is also a working material found inside switches, circuit boards, solar cells, vehicles and industrial equipment. The industrial side now accounts for more than half of annual silver demand, yet the story is becoming less [&#8230;]</p>
<p>The post <a href="https://riosilverinc.com/industrial-silver-demand-solar-ev-ai/">Industr… Silver Demand: How Solar, EVs and AI Are Reshaping the Market</a> first appeared on <a href="https://riosilverinc.com">Rio Silver Inc.</a>.</p>

Image URL
https://riosilverinc.com/wp-content/uploads/2026/01/Rio-Silver_High-resolution-print-logo-01-scaled.jpg
Content Hash (SHA-256, erste 32 hex)
9118ad03e9fffca40acdc4108dbea116
Is Investing in Latin America Mining Stocks Profitable? Risks and Rewards
Image File
Original HTML

Latin America mining stocks give investors plenty to like, but very little that can be judged in isolation.

Mexico remains the world’s largest silver producer. Peru sits near the top of both silver and copper production. Chile is still central to global copper supply, while Argentina has spent the past two years trying to draw more large-scale mining capital into the country. None of that removes the harder part of the investment case: mines are fixed assets, so companies have to work with the permits, communities, infrastructure and political conditions around them.

That is why a promising deposit in Latin America can become an excellent asset, a frustratingly slow one, or something that never reaches production at all. For shareholders, the quality of the geology matters enormously, but so does the company’s ability to turn that geology into a functioning business.

Key Takeaways

- Mexico and Peru are major global silver producers, while Chile and Peru remain two of the world’s leading copper jurisdictions.

- Latin America’s appeal comes from mineral endowment, established mining districts and large existing industries, not from uniformly low risk.

- Permitting, local opposition, security problems, tax changes and political decisions can materially change project economics.

- A 2026 Americas Market Intelligence estimate put mining investment lost or stalled by above-ground issues in the region since 2018 at more than US$54 billion. That is an industry estimate, not an independently audited regional total.

- The most useful way to assess a Latin American mining stock is at project level rather than treating an entire country as one risk category.

Can Investing in Latin American Mining Stocks Be Profitable?

Yes, it can. But “Latin America” is not an investment thesis in itself.

A company can make money because it owns a strong deposit, operates at competitive costs, expands production or successfully advances an undeveloped asset. Shareholders can also benefit when exploration changes expectations around a project. None of those outcomes comes simply from operating in Peru, Mexico, Chile or any other mining country.

The opposite is also true. A good orebody can sit idle if approvals drag on or financing dries up. Production can be interrupted even after a mine has been built. For junior companies, where one project may account for most of the company’s value, these setbacks tend to matter more than they do for a diversified multinational miner.

So the region offers real opportunity, but the likely return depends on far more than commodity prices. When investors ask whether Latin America mining stocks are profitable, the useful answer is: they can be, when good geology is matched by workable permitting, financing, infrastructure and local relationships.

Why Mining Companies Keep Coming Back to Latin America

The easiest explanation is found in the production numbers.

The USGS estimated that Mexico produced roughly 6,300 tonnes of silver in 2025. Peru produced about 3,600 tonnes, putting the two countries first and second globally. In copper, Chile produced an estimated 5.3 million tonnes and Peru about 2.7 million tonnes during the same year. Those are not marginal mining jurisdictions. They form part of the core global supply base.

That history creates an advantage that new mining regions cannot build quickly. Established districts often already have contractors, geologists, mining engineers, laboratories and transport networks. In some areas there are operating mills or power infrastructure within practical distance of new projects. None of this guarantees that a junior mine will work economically, but it can change the amount of capital and time required to move an asset forward.

Peru’s current project pipeline gives some sense of the scale still being pursued. The country’s Ministry of Energy and Mines lists 66 projects in its 2026 Mining Investment Project Portfolio, representing estimated combined investment of about US$64.1 billion. A separate exploration portfolio contains 69 projects with planned investment of US$757 million.

Those are pipeline values, not promises of future mines. Some projects will advance, some will change and some may never be built. Still, it is difficult to argue that capital has abandoned the country.

Argentina Is a Different Kind of Mining Story

Argentina is interesting because the opportunity case is being shaped as much by policy as by existing production.

The country already forms part of South America’s lithium triangle and has attracted attention around several large copper projects. The challenge has long been the wider economic environment, including inflation, currency controls and shifts in investment rules.

RIGI, the country’s incentive regime for large investments, is intended to address some of those concerns through tax, customs and legal benefits for qualifying projects. In February 2026, the government extended the application period for another year from July 8, 2026.

That does not suddenly make Argentina a low-risk jurisdiction. Mining regulation also interacts with provincial authority, so the experience of a project in San Juan may differ from one in another province. What RIGI does show is that policy can move in both directions: jurisdiction risk is not only about governments placing new restrictions on mining.

What Are the Biggest Mining Stock Risks in Latin America?

The risks of Latin America mining stocks are usually more specific than “political risk”, a label that is often too broad to be useful on its own.

A shareholder loses money because something specific happens. A permit does not arrive when expected. A road blockade stops concentrate shipments. A royalty changes. A company needs another financing because development takes an extra year. Security problems make an exploration program more expensive or impossible to run.

Those are the risks worth examining.

Americas Market Intelligence tried to put a value on this problem in research released in September 2026. It estimated that regulatory delays, community disputes, security issues and other above-ground risks had caused or stalled more than US$54 billion of mining investment across Latin America since 2018.

The number is striking, but it needs context. It is AMI’s estimate rather than a government total, and it has not been independently audited across the entire region. It is best used as evidence of the scale of the issue, not as a precise accounting of every dollar lost.

A Permit Delay Can Become a Financing Problem

Mining companies spend money long before they sell metal.

Exploration programs require capital. Environmental work, technical studies and community engagement cost money. Once a project reaches development, the sums become much larger. If the next approval is delayed, the company does not simply stop having expenses while it waits.

This becomes especially relevant with junior mining stocks. A producer may be able to fund delays from operating cash flow. A pre-production company may need to issue new shares. What began as permitting risk then becomes dilution risk for existing shareholders.

Peru has recently moved to simplify parts of its exploration framework, which is useful context rather than proof that permitting is now easy. The government has also made project-unblocking and administrative reform part of its investment agenda. The direction may be favourable for some projects, but investors still need to check which approvals a company actually holds instead of relying on general claims about regulatory improvement.

Community Support Is Not a Box to Tick Once

Mining projects can remain in an area for decades, so relations with nearby communities are rarely settled by one meeting or one signed document.

Concerns vary. Water access can be central in one district, employment in another. Land rights, environmental effects, traffic, compensation and benefit sharing can all become points of dispute. In Peru, where mining regions have experienced both successful long-term operations and prolonged conflict, the difference often comes down to local circumstances rather than a national rule.

This is where investor research needs to become more concrete. Has the company been able to conduct fieldwork without repeated interruption? Does it have formal land-access agreements? What exactly do those agreements permit? Are they temporary exploration arrangements or something broader?

A presentation that says a company enjoys a “strong social licence” tells you much less than documented evidence of what the company can actually do on the ground.

Rules Can Change After the Money Is Spent

A mine cannot move to another country if regulation becomes less favourable.

Governments can revise taxes, royalties, environmental standards, ownership requirements or concession rules. These changes are not automatically unreasonable. Mining states have legitimate reasons to regulate resource development and determine how economic benefits are shared.

The shareholder risk comes from unpredictability. A project modelled under one set of fiscal or regulatory assumptions may look different if those rules change after significant capital has been committed.

Mexico is worth watching on this front. It remains the world’s largest silver producer, but recent mining and environmental policy has made the regulatory picture more restrictive in some areas, particularly where concessions intersect with protected land or sensitive environmental zones.

That does not amount to a simple “Mexico is bad for mining” conclusion. It means project location and legal status matter more than a national production ranking.

Security Risk Is Local Too

Security is another area where national labels can mislead.

A company working in an established mining district with regular road access may face a completely different risk profile from one exploring in an isolated area affected by illegal mining or organized crime.

Class (B2B/B2C)
B2C
Ingest Status
Rewritten
Dedupe hash
0f07c9c7830577b9083804061625f99c
Press Eligible
Yes
Press Eligible Reason
Manuelle Prüfung nötig. Risiko: MEDIUM. Flags: ['finance', 'numbers']. Stichprobe: False
Source Name
Rio Silver, Inc.
Original Summary

<p>Latin America mining stocks give investors plenty to like, but very little that can be judged in isolation. Mexico remains the world&#8217;s largest silver producer. Peru sits near the top of both silver and copper production. Chile is still central to global copper supply, while Argentina has spent the past two years trying to draw [&#8230;]</p>
<p>The post <a href="https://riosilverinc.com/latin-america-mining-stocks-risks-rewards/">Is Investing in Latin America Mining Stocks Profitable? Risks and Rewards</a> first appeared on <a href="https://riosilverinc.com">Rio Silver Inc.</a>.</p>

Image URL
https://riosilverinc.com/wp-content/uploads/2026/01/Rio-Silver_High-resolution-print-logo-01-scaled.jpg
Content Hash (SHA-256, erste 32 hex)
2837f2b0b79c3f3e0dffb7153cbf9f01
Physical Silver vs Silver Stocks vs ETFs: Which Is Right for You?
Image File
Original HTML

Buying silver does not necessarily mean buying a bar and putting it in a safe.

Investors can own silver bullion directly, buy shares of companies that explore for or produce silver, or use exchange-traded products that provide exposure through a brokerage account. All three routes are linked to silver, but that is where much of the similarity ends.

Bullion gives you the metal itself. Mining shares give you part ownership of a business. Exchange-traded silver products can provide either bullion exposure or a diversified basket of mining companies.

The right choice depends less on which option is “best” and more on what you expect silver to do in your portfolio.

Key Takeaways

- There is no single best way to invest in silver. Physical bullion, silver stocks and exchange-traded products offer different combinations of ownership, risk and convenience.

- Physical silver gives you direct ownership, but dealer spreads, storage and insurance can add to the cost.

- Silver stocks can move more sharply than the metal because company results, costs, discoveries and financing affect their value as well as the silver price.

- Bullion-linked exchange-traded products make silver-price exposure easier to buy and sell through a brokerage account, while mining ETFs spread the investment across several companies.

- In Canada, qualifying investment-grade silver receives specific GST/HST treatment, and certain forms of physical silver can also qualify for registered plans when CRA requirements are met.

- Some investors use more than one form of silver exposure because each serves a different purpose.

What Is the Best Way to Invest in Silver?

There is no universal best way to invest in silver.

Physical silver gives direct ownership of the metal. Silver stocks add company-specific growth potential and risk. Exchange-traded silver products offer a simpler way to gain exposure through financial markets.

That distinction is important.

Someone buying silver as a tangible store of value may care more about possession than daily liquidity. An investor who wants to trade silver exposure inside a brokerage account will probably value convenience more. Someone researching individual mining companies is accepting an entirely different risk profile in the hope that a successful business or project can outperform the metal itself.

So before deciding how to invest in silver, decide what you actually want from the investment: direct ownership, silver-price exposure, or exposure to mining-company growth.

How Does Physical Silver Work?

Physical silver is the most literal form of silver ownership. You purchase coins, bars, ingots or other bullion products and own the metal itself.

For many people, that is its main attraction. There is no mining management team to assess and no fund structure between the owner and the asset.

It is not friction-free, however.

If you are working out how to buy silver for the first time, the first cost to understand is the premium over spot.

The Price You Pay Is Not Usually the Spot Price

Silver has a quoted market price, commonly called the spot price, but retail buyers rarely purchase coins or small bars at exactly that level.

Dealers generally charge a premium. Manufacturing, distribution, product size, supply conditions and dealer margins can all influence it.

The gap works both ways. A dealer buying silver back from an investor may offer less than the retail selling price.

For someone investing in silver bullion, that spread matters because the silver price may need to rise before the original transaction costs are recovered.

Premiums also vary. A widely recognized one-ounce coin can trade differently from a large bullion bar, even though both ultimately contain silver.

Then There Is Storage

A few coins are relatively easy to keep securely. A substantial allocation is another matter.

Home storage introduces theft and insurance questions. Safety deposit boxes and professional vaults can add recurring fees. Investors should also think about access: silver locked in a vault is not as immediately tradable as a security sitting in a brokerage account.

Liquidity is generally available through bullion dealers, but it is not identical to clicking “sell” on an exchange.

What About GST/HST in Canada?

Canadian tax treatment deserves careful wording.

For GST/HST purposes, the Canada Revenue Agency defines qualifying silver precious metal as silver refined to at least 99.9% purity and supplied in qualifying forms such as a bar, ingot, coin or wafer.

Qualifying precious-metal transactions receive specific treatment under the Excise Tax Act. Newly refined metal supplied by the refiner or owner can be zero-rated, while subsequent qualifying supplies are generally treated as exempt financial services.

In practical terms, qualifying investment-grade bullion is treated differently from jewellery, collectibles and lower-purity silver. A product should not be assumed to qualify merely because it contains silver.

How Do Silver Stocks Work?

Buying a silver stock does not give you ownership of silver sitting in a vault.

You own part of a company.

That company might already operate mines, it might be developing a deposit, or it might still be exploring ground where no mine has yet been established. Those stages carry very different risks.

Producers

A producer sells metal and earns revenue from mining operations.

Pan American Silver is one example of a large publicly traded precious-metals producer. Companies at this stage are affected by silver prices, but also by costs, production levels, mine life, grades, labour, energy, taxes and the performance of individual operations.

This is where the idea of leverage to silver often comes from.

Imagine, purely as an illustration, that a mine receives $30 per ounce of silver and has $24 per ounce of associated costs. The difference is $6. If the realized silver price rises while costs remain broadly stable, the percentage change in the margin can be much larger than the percentage move in silver.

Real mine economics are far more complicated, of course. Costs are not fixed, and silver is often produced alongside gold, lead, zinc or other metals.

The basic point remains: a mining company’s earnings do not necessarily move one-for-one with silver.

Developers and Junior Explorers

Further down the development curve are companies that do not yet have established commercial production.

Their shares can react to drilling, metallurgical work, permitting, financing, resource estimates and other project milestones. That creates potential upside, but it creates plenty of ways for expectations to go wrong too.

Rio Silver Inc. (TSX-V: RYO | OTC: RYOOF), for example, describes itself as a Canadian silver exploration and development company focused on advancing high-grade silver projects in Peru. Its Maria Norte project is currently classed by the company as exploration to early development.

That makes it fundamentally different from a producing miner.

For junior companies, a higher silver price can improve market sentiment without solving exploration, financing or development challenges. Share dilution is another consideration because companies without operating cash flow often need outside capital to keep advancing their projects.

Readers who want to go deeper into this part of the market can see our guide to how to evaluate junior silver mining stocks and our separate article on how to invest in silver stocks.

How Do Silver ETFs and Exchange-Traded Products Work?

This category needs one distinction up front: not every product commonly called a “silver ETF” works the same way.

Some products are built to reflect movements in silver bullion. Others own mining companies.

Those are two quite different exposures.

Bullion-Linked Products

The iShares Silver Trust (SLV) is one of the best-known examples.

Its objective is to reflect the price performance of silver bullion, less the trust’s expenses. It provides access through an exchange, so investors can buy or sell shares through a brokerage rather than arranging delivery and storage of their own bars.

SLV currently charges a 0.50% sponsor fee.

Strictly speaking, SLV is an exchange-traded trust, not a conventional U.S. ETF registered under the Investment Company Act of 1940. The distinction does not change the basic reason many investors use it, but it is worth getting the terminology right.

The investor owns shares in the trust rather than silver coins sitting in a personal vault.

That removes the practical work of storing bullion, but it also means the investment is held through a financial structure rather than through direct personal possession of metal.

Mining ETFs

A mining ETF takes another route entirely.

The Global X Silver Miners ETF (SIL), for example, seeks to track an index of global silver mining companies. Its current total expense ratio is 0.65%.

Instead of choosing one producer or junior company, the investor gets exposure to a group of businesses.

That diversification can reduce the impact of a problem at any single company. It does not remove mining-sector risk.

If costs rise across the industry, equity markets weaken or mining companies fall out of favour, a miners ETF can lag the silver price. Conversely, strong margins and favourable market sentiment can sometimes produce gains beyond the movement in bullion.

This is why investors searching for the “best silver ETF” should first ask whether they actually want silver bullion exposure or mining-company exposure.

Physical Silver vs Silver Stocks vs ETFs: Side by Side

There is no clean risk ladder in which one format is always better than another. Each introduces a different set of trade-offs.

A table like this also shows why comparing only a silver ETF vs physical silver leaves out an important part of the market.

A bullion product is designed primarily around the silver price. A mining company has employees, assets, financing needs, operating decisions and geological risk.
Class (B2B/B2C)
B2C
Ingest Status
Rewritten
Dedupe hash
269217c39fb7917ad444d013ab16ccdf
Press Eligible
Yes
Press Eligible Reason
Manuelle Prüfung nötig. Risiko: MEDIUM. Flags: ['finance', 'numbers']. Stichprobe: False
Source Name
Rio Silver, Inc.
Original Summary

<p>Buying silver does not necessarily mean buying a bar and putting it in a safe. Investors can own silver bullion directly, buy shares of companies that explore for or produce silver, or use exchange-traded products that provide exposure through a brokerage account. All three routes are linked to silver, but that is where much of [&#8230;]</p>
<p>The post <a href="https://riosilverinc.com/physical-silver-vs-silver-stocks-vs-etfs/">Phy… Silver vs Silver Stocks vs ETFs: Which Is Right for You?</a> first appeared on <a href="https://riosilverinc.com">Rio Silver Inc.</a>.</p>

Image URL
https://riosilverinc.com/wp-content/uploads/2026/01/Rio-Silver_High-resolution-print-logo-01-scaled.jpg
Content Hash (SHA-256, erste 32 hex)
4544d34092ea6fc01d24376c564708ee
Why High-Grade Silver Deposits Matter: Grade, Economics and Investor Returns
Image File
Original HTML

“High-grade” is one of the most common phrases in silver exploration news. It is also one of the easiest to misunderstand.

A grade tells you how much silver is present in a given amount of rock. That matters, but it does not tell you whether the rock can be mined profitably. A narrow vein carrying several hundred grams of silver per tonne may be attractive in one setting and impractical in another. Meanwhile, a large open-pit deposit containing only a fraction of that grade can still support a mine if tonnes, recovery, mining costs and processing conditions work in its favour.

For investors, the useful question is not simply whether a silver number looks high. It is what that grade means once width, continuity, metallurgy, mining method and cost are added to the picture.

Key Takeaways

- Silver grade is usually reported in grams of silver per metric tonne of rock, written as g/t Ag.

- More metal per tonne can improve project economics, but grade does not determine profitability on its own.

- There is no official industry rule that makes, for example, 100 g/t “low-grade” or 500 g/t “high-grade” across all silver deposits.

- Cut-off grade depends on metal prices, recoveries, mining and processing costs, mine design and other project assumptions.

- A spectacular channel or drill sample is evidence of mineralization, not proof of a mine, resource or reserve.

- The strongest investment cases usually combine grade with mineable width, continuity, recovery, scale, infrastructure and a credible development plan.

What Does a Silver Grade Actually Tell You?

When a company reports 200 g/t Ag, it means the sampled material contains an average of 200 grams of silver for every metric tonne represented by that sample.

The measurement is simple enough. Interpreting it is not.

A tonne of rock carrying 500 g/t silver contains five times as much silver as a tonne carrying 100 g/t, before allowing for recovery losses. That gives higher-grade material an obvious advantage: there is more potentially saleable metal in every tonne that has to be mined, moved and processed.

The catch is that mines do not sell grade. They sell recovered metal.

If only part of the silver can be recovered economically, or if the mineralized zone is too narrow, discontinuous or difficult to access, a striking assay may have limited economic value. Mining dilution can also reduce the grade actually delivered to the plant when waste rock has to be removed with the ore.

That is why technical reports eventually move beyond assay values and start dealing with mining widths, recoveries, dilution, throughput, costs and cut-off grades.

What About AgEq?

Polymetallic projects often report silver-equivalent grade, usually written AgEq.

AgEq converts the estimated value of several metals into an equivalent quantity of silver. A deposit containing silver, gold, lead and zinc, for example, may be presented as a single silver-equivalent number to make the combined metal value easier to compare.

The calculation is only as useful as its assumptions. Metal prices, metallurgical recoveries, treatment charges and other conversion factors can materially change the result, which is why Canadian technical-disclosure guidance requires those assumptions to be explained when equivalent grades are used.

Two projects reporting the same AgEq grade may therefore have quite different economics.

High-Grade vs Low-Grade Silver: What Counts as High-Grade?

There is no universal answer, and that is an important point for investors.

The economics of an underground vein mine are different from those of a large open-pit operation. A deposit with significant gold, lead or zinc credits is different again. Metal prices change, recovery assumptions change, and what qualifies as economic material can change with them.

Real mines show just how wide the range can be.

Coeur Mining’s Rochester operation in Nevada reported 2025 proven and probable silver reserves averaging about 12.63 g/t Ag. Rochester is a very large-tonnage open-pit operation using heap leaching. At the other end of the spectrum, Fresnillo reported a 2024 silver ore grade of 468 g/t at Juanicipio, an underground silver operation in Mexico. Hecla’s year-end 2025 reserves at Keno Hill were reported at 25.28 ounces of silver per ton, roughly 867 g/t in metric terms.

None of those numbers can sensibly be judged using one fixed “good grade” threshold.

This is an interpretive guide, not an industry classification system. A lower-grade deposit can outperform a higher-grade one if it is easier and cheaper to mine.

The reverse is equally true.

How Does Grade Affect Silver Mining Economics?

The advantage of higher grade becomes easier to understand when you follow one tonne of rock through a mine.

That tonne has to be drilled, blasted or excavated, hauled, crushed and processed. Many of those costs are incurred whether the tonne contains 50 grams of silver or 500.

If two otherwise identical tonnes cost the same amount to mine and process, the tonne containing more recoverable silver spreads those costs over more ounces. That can reduce the cost per ounce and leave more margin between the realized metal price and the cost of producing it.

Real mines are never that tidy, but the mechanism is important.

Cut-Off Grade Is an Economic Decision, Not a Geological Label

Mining companies do not normally process every piece of mineralized rock they encounter.

They establish a cut-off grade or cut-off value that helps distinguish material expected to have economic value from material that does not meet the current economic criteria. CIM guidance makes clear that cut-off grades vary between properties, operating circumstances and even different periods at the same operation.

The calculation can include mining costs, processing costs, expected recovery, metal prices and other factors. In polymetallic deposits, companies may use net smelter return rather than a simple silver grade because several metals contribute to revenue.

Aya Gold & Silver’s Zgounder technical work gives a useful real-world example. Its 2025 disclosure used different resource cut-offs for different mining methods: 40 g/t Ag for open-pit material and 90 g/t Ag for underground material. Same deposit, same metal, different economic assumptions.

This is exactly why a universal “high-grade” table can mislead.

Grade and Recovery Have to Be Read Together

Assay grade tells you how much metal is present in the sample. Metallurgical recovery tells you how much of that metal the planned process is expected to extract.

If a tonne contains 300 grams of silver and a process recovers 90%, the recovered silver is very different from a deposit where only 55% can be extracted. Treatment and refining terms may reduce the payable amount further.

The same logic applies to by-products. Lead, zinc or gold can improve the economics of a silver mine if they are recoverable and payable, sometimes materially reducing the effective cost attributed to silver production.

This is one reason comparing companies solely on headline silver grades is risky. The ore may look richer on paper while generating less economic value after recovery and processing.

Does Higher Grade Mean Lower Cost Per Ounce?

Often, but not automatically.

If mining and processing costs per tonne are broadly similar, getting more payable ounces from each tonne should improve unit economics. Higher grade can therefore give a mine more room to absorb changes in labour, energy, consumables or metal prices.

But higher-grade deposits can also be expensive to mine.

Narrow underground veins may require selective mining, more development metres and greater ground-control work. Dilution can be particularly damaging because waste rock mixed with a narrow vein reduces the grade sent to the mill. Difficult geometry can slow production, while depth can increase ventilation, hauling and pumping costs.

A large, low-grade surface mine can sometimes move a tonne of material much more cheaply than a narrow-vein underground mine carrying far more silver in each tonne.

The cost outcome depends on both sides of the equation.

A Note on AISC

Investors often use all-in sustaining cost, or AISC, when comparing producing mining companies. The metric was developed to provide a broader view of the cost of maintaining current production than a simple mine-site cash-cost figure. It can include items such as sustaining capital, corporate overhead and reclamation-related costs.

AISC is a non-GAAP measure, however, and reporting practice can vary between companies. It is useful for understanding an existing producer, but it should not be casually applied to an early-stage explorer that has not defined a mine or production plan.

For a junior exploration company, talking about future AISC before sufficient technical work exists would create a false sense of precision.

What Can Grade Mean for Shareholders?

This is where a geological number starts to become an investment question.

A meaningful high-grade discovery can change how the market views a junior company because it may improve the potential value of the mineralized system. Repeated high-grade intercepts over useful widths can justify further drilling, influence resource expectations and eventually feed into economic studies.

That does not mean a high assay automatically creates shareholder value.

Markets often react to individual drill results long before enough information exists to judge continuity, mineability or economics. If later drilling fails to connect the mineralization, the early excitement can disappear just as quickly. Exploration companies can also dilute shareholders while raising the capital required to establish whether a discovery is commercially useful.

Once a project reaches the mine-study stage, grade can have a more direct economic effect.

Class (B2B/B2C)
B2B
Ingest Status
Rewritten
Dedupe hash
f6565eb5fe5b5f792e88b2d98e7a4614
Press Eligible
Yes
Press Eligible Reason
Manuelle Prüfung nötig. Risiko: MEDIUM. Flags: ['numbers']. Stichprobe: False
Source Name
Rio Silver, Inc.
Original Summary

<p>“High-grade” is one of the most common phrases in silver exploration news. It is also one of the easiest to misunderstand. A grade tells you how much silver is present in a given amount of rock. That matters, but it does not tell you whether the rock can be mined profitably. A narrow vein carrying [&#8230;]</p>
<p>The post <a href="https://riosilverinc.com/why-high-grade-silver-deposits-matter/">Why High-Grade Silver Deposits Matter: Grade, Economics and Investor Returns</a> first appeared on <a href="https://riosilverinc.com">Rio Silver Inc.</a>.</p>

Image URL
https://riosilverinc.com/wp-content/uploads/2026/01/Rio-Silver_High-resolution-print-logo-01-scaled.jpg
Content Hash (SHA-256, erste 32 hex)
b855c1e369df37a6e017c0617d1712f5
Highlander Silver Welcomed by President Keiko Fujimori of Peru
Image File
Original HTML

Download this press release:

Toronto, October 13, 2026 – Highlander Silver Corp. (TSX, NYSE American: HSLV) (“Highlander Silver” or the “Company”) is pleased to report on a recent meeting with President Keiko Fujimori and Minister of Energy and Mines Guillermo Shinno Huamaní in Lima.

Daniel Earle, President & CEO of Highlander Silver, commented:

“Highlander Silver was deeply honoured to be welcomed by President Fujimori and Minister Shinno to the Palacio de Gobierno in Lima last week. We presented our vision for the responsible development of the Corani Silver Project and its potential to lay the foundation for sustainable economic development in the region. Central to that vision is sharing project-built road, power and communications infrastructure with local communities, alongside providing preferential access to jobs and business opportunities.”

Figure 1

Figure 1: Highlander Silver executives meet with President Keiko Fujimori and Minister of Energy and Mines Guillermo Shinno in Lima on October 6, 2026 (Photo: Government of Peru).

On behalf of Highlander Silver

“Daniel Earle”

President and CEO

Information contact

Arun Lamba, Vice President Corporate Development

alamba@highlandersilver.com

About Highlander Silver

Highlander Silver is a high-quality silver-growth company developing a portfolio of advanced-stage assets in Peru which includes the bonanza-grade San Luis gold-silver project, which ranks among the 10 highest-grade projects globally in both gold and silver categories, and the Corani silver project, the largest silver deposit in development globally.[1] The Company also operates the Mercedes gold-silver mine in Mexico. Highlander Silver’s major shareholders include the Augusta Group, Lundin family, and Eric Sprott.

Forward-looking statements

Certain information contained in this news release constitutes “forward-looking information” under Canadian securities legislation. This includes, but is not limited to: statements regarding the sharing project-built road, power and communications infrastructure with local communities, alongside providing preferential access to jobs and business opportunities. Such forward looking information or statements can be identified by the use of words such as “anticipates”, “expects”, “intends”, “believes”, “plans”, “may”, “subject to” or “underway” or variations (including negative variations) of such words and phrases, or state that certain actions, events or results “will” be taken, occur, or be achieved. Forward-looking information is based on management’s reasonable assumptions, estimates, expectations, analyses and opinions, including: assumptions with regard to development of Corani; the ability to secure adequate financing; the Company maintaining its current strategy and objectives; and the Company’s ability to achieve its growth objectives. Forward-looking information involves known and unknown risks, uncertainties, and other factors which may cause the actual results, performance, or achievements of the Company and/or its subsidiaries to be materially different from any future results, performance, or achievements expressed or implied by the forward-looking information. Such factors include, among others: general business, economic, competitive, political and social uncertainties; the actual results of current exploration activities; changes in project parameters as plans continue to be refined; future prices of precious and base metals; accident, labour disputes and other risks of the mining industry; delays in obtaining governmental or stock exchange approvals or financing; and risks related to the facility with Natixis CIB, including that definitive documentation may not be completed on the terms contemplated or at all, ongoing due diligence may not be completed to the satisfaction of Natixis CIB, conditions precedent may not be satisfied, the cost overrun facility may not be established on acceptable terms or at all, closing or drawdowns under the facility may be delayed or may not occur, interest rates may change, or project costs may increase, or the development of the Corani Silver Project may be delayed, cost more than anticipated or be adversely affected by technical, environmental, social, permitting, construction or other development risks. Although the Company has attempted to identify important factors that could cause actual actions, events or results to differ materially from those described in forward-looking information, there may be other factors that could cause actions, events or results to differ from those anticipated, estimated or intended. Forward-looking information contained herein is made as of the date of this news release. There can be no assurance that forward-looking information will prove to be accurate, as actual results and future events could differ materially from those anticipated in such statements. The Company undertakes no obligation to update forward-looking information if circumstances or management’s estimates or opinions should change, except as required by applicable securities laws. Accordingly, the reader is cautioned not to place undue reliance on forward-looking information.

[1] S&P Global rankings including the Corani silver project and San Luis gold-silver project.

Class (B2B/B2C)
B2B
Ingest Status
Rewritten
Dedupe hash
75eef09ecba4fa814e368a227e639d8b
Press Eligible
Yes
Press Eligible Reason
Mining company news about project development and a meeting with government officials.
Source Name
Highlander Silver Corp.
Original Summary

<p>Toronto, October 13, 2026 – Highlander Silver Corp. (TSX, NYSE American: HSLV) (“Highlander Silver” or the “Company”) is pleased to report on a recent meeting with President Keiko Fujimori and Minister of Energy and Mines Guillermo Shinno Huamaní in Lima. </p>
<p>The post <a href="https://highlandersilver.com/news/highlander-silver-welcomed-by-preside… Silver Welcomed by President Keiko Fujimori of Peru</a> appeared first on <a href="https://highlandersilver.com">Highlander Silver</a>.</p>

Image URL
https://secure.gravatar.com/avatar/c194108970a35af27233c51cc0a51a8e336113e851581dd2620a8fe729b09ff6?s=96&d=mm&r=g
Content Hash (SHA-256, erste 32 hex)
46f52a03b1bddeeaa61c8b7ff93d4df2
Employment Law Attorneys, at Blumenthal Nordrehaug Bhowmik De Blouw LLP, Filed a Lawsuit Against Redtail Technology, Inc. for Alleged Violation of Meal & Rest Period Requirements
Image File
Original HTML

Redtail Technology, Inc. allegedly failed to provide their employees legally required meal periods and rest periods, among other things. This resulted in various other California Labor Code allegations.

**THIS IS AN ATTORNEY ADVERTISEMENT**

VENTURA, Calif., Oct. 30, 2026 /PRNewswire/ -- The Sacramento employment law attorneys, at Blumenthal Nordrehaug Bhowmik De Blouw LLP, filed a class action complaint alleging that Redtail Technology, Inc. violated the California Labor Code. The Redtail Technology, Inc. class action lawsuit, Case No. 26CV022766, is currently pending in the Sacramento County Superior Court of the State of California. A copy of the Complaint can be read here.

According to the lawsuit filed, Redtail Technology, Inc. allegedly required employees to work during their meal periods. These employees were allegedly, from time to time, unable to take thirty (30) minute off duty meal breaks and/or were not fully relieved of duty for their meal periods. Additionally, the employees were required to perform work as ordered by Defendant for more than five (5) hours during some shifts without receiving a meal break. Further, Defendant often allegedly failed to provide employees with a second off-duty meal period for some workdays in which these employees were required by Defendant to work ten (10) hours of work. Defendant also, allegedly, engaged in the practice of rounding the meal period times to avoid paying penalties to Employees. Therefore, employees unknowingly forfeited meal breaks without additional compensation.

The Complaint further alleges Plaintiff was required by Defendant to use their own personal cellular phones as a result of and in furtherance of their job duties as employees for Defendant but were not reimbursed or indemnified by Defendant for the cost associated with the use of their personal cellular phones for Defendant's benefit. Defendant allegedly violated Cal. Lab. Code § 2802.

For more information about the class action lawsuit against the Redtail Technology, Inc. call (800) 568-8020 to speak to an experienced California employment attorney today.

Blumenthal Nordrehaug Bhowmik De Blouw LLP is an employment law firm with offices located in San Diego, San Francisco, Sacramento, Los Angeles, Riverside and Chicago that dedicates its practice to helping employees, investors and consumers fight back against unfair business practices, including violations of the California Labor Code and Fair Labor Standards Act. If you need help in collecting unpaid overtime wages, unpaid commissions, being wrongfully terminated from work, and other employment law claims, contact one of their attorneys today.

**THIS IS AN ATTORNEY ADVERTISEMENT**

Media Contact

Nicholas De Blouw

Blumenthal Nordrehaug Bhowmik De Blouw LLP

(800) 568-8020

[email protected]

https://www.bamlawca.com/ 

SOURCE Blumenthal Nordrehaug Bhowmik De Blouw LLP

Share this article

Class (B2B/B2C)
Ignore
Ingest Status
Need Review
Dedupe hash
prn_302925434
Press Eligible
No
Press Eligible Reason
Irrelevant (need review): Law firm advertisement announcing a class action lawsuit against a company.
Source Name
Unknown Company
Original Summary

<p>Redtail Technology, Inc. allegedly failed to provide their employees legally required meal periods and rest periods, among other things. This resulted in various other California Labor Code allegations. **THIS IS AN ATTORNEY ADVERTISEMENT** VENTURA, Calif., Oct. 30, 2026 /PRNewswire/ --...</p>

Image URL
https://mmx.prnewswire.com/media/MS1128004/blumenthal-nordrehaug-bhowmik-de-blouw-llp-1080p.mp4?id=OA3050691&p=thumbnail
Content Hash (SHA-256, erste 32 hex)
275373458a3d2588288365ff1a109903