Paying Subscribers Hit a Record High of 19.83 Million!
Image File
Original HTML

Paying Subscribers Hit a Record High of 19.83 Million!

Meitu, Inc.ï¼Stock Code: 1357.HKï¼2026 Investor Day Highlights Focused AI Innovation and Global "Scale-Up"

HONG KONG, Oct. 29, 2026 /PRNewswire/ -- Meitu, Inc. (collectively, "Meitu" or "Company" and stock code: 1357.HK), a global leading provider of AI-powered photo, video, design and productivity solutions, held its 2026 Investor Day on October 26. Mr. Xinhong Wu, Founder, Chairman and CEO, appeared together with management including Mr. Gary Ngan, CFO and Company Secretary, and Mr. Jianyi Chen, CPO and President of the Imaging Products Division. They gave investors and analysts worldwide a comprehensive update on the Company's latest strategic direction in the generative AI era, its product progress, the restructured commercialisation framework and its global expansion results.

Paying Subscribers and Core Revenue Both Grew, Reaching a Four-Quarter High

As of September 2026, Meitu's global paying subscribers reached 19.83 million, with 1.39 million added in the quarter, representing the largest quarterly net increase in the past four quarters.

Paying subscribers of Applications for Productivity grew 18.3% year-on-year to 2.39 million. Annual Recurring Revenue ("ARR") for AI-driven Productivity Applications reached RMB655 million, up a strong 40.1% year-on-year.

Meitu's business performance in the third quarter of 2026 showed that revenue (unaudited) from its core photo, video and design products reached RMB1.0 billion, up 28.2% year-on-year. This reflects its strong monetisation capability and the resilience of its subscription model in generating revenue.

Strategic Focus on Validated Products, Launching a Sustained "Scale-Up" Phase

Management announced that the Company's exploration of AI innovation has entered a new stage. It will gradually narrow its exploratory scope and prioritize resource allocation to a group of core products that have validated product-market fit ("PMF"). Mr. Xinhong Wu noted that this closely resembles Meitu's experience in the early days of the mobile internet: after many experiments, the Company confirmed a clear direction and then committed to scaling it up with resources over the long term.

Among the Company's innovative products, Picchi's latest Net Billings ARR is close to US$1.4 million. MVLAND's Net Billings ARR is close to US$0.85 million, and its application is planned to launch this December. When an innovative project's ARR reaches the milestones of US$2 million and US$5 million, the Company will unlock additional strategic resources for it.

Drawing on the Fashion Consumer Goods Playbook: Features as Products

In overseas markets, consumers are long accustomed to paying for quality software subscriptions. Given the high computing costs in the AI era, Meitu will increasingly model on the commercial strategies of fashion consumer goods, treating "features as products" and making paying subscribers its core target group.

Mr. Gary Ngan, CFO, emphasised that Meitu has more new businesses that monetise through AI credits consumption, which offer greater ARPPU elasticity than traditional products. The Company is more focused on real growth in overall product revenue and net profit than on gross margin, which is merely an intermediate indicator.

Productivity Business Accelerates Overseas Expansion and Shifts Toward End-to-End Marketing Solutions

In its global strategy, Meitu now designs products for the global market right from the initial research and project inception phase.

Mr. Xinhong Wu explained that Meitu places great importance on overseas markets. Its globalisation strategy has successfully moved beyond the first stage of "language-based regions" to add "cultural regions" (for example, the Latin American cultural region represented by Brazil and Mexico), making its global operations more refined and professional. Beyond establishing local operations teams, Meitu has also built local effects design teams to understand and meet the distinct aesthetic preferences of local users. Both Kaipai, aimed at Mainland China, and Vmake Labs, aimed at international markets, delivered impressive results, with ARR for each growing by more than 100% year-on-year as of September 2026.

In addition, Mr. Jianyi Chen, CPO, said that Meitu is moving from offering productivity tools to offering complete marketing solutions. In the past, Meitu provided productivity tools, and users handled content creation and subsequent promotion themselves. With the development of AI Agent capabilities, Meitu has begun to cover the full chain from marketing planning and content production to content distribution and performance optimisation.

Mr. Jianyi Chen believes Meitu's future business model may increasingly resemble that of an AI-driven marketing services company. "Customers are no longer just purchasing a set of creation tools, but marketing outcomes that help them increase sales."

About Meitu Inc.

Founded in 2008, Meitu is an AI-driven technology company that regards "beauty" as its core ideal. Guided by our mission to "Uniting Art and Technology", Meitu is committed to creating world-class imaging products that simplify the creation of images, videos, designs, and other visual content. Meitu was listed in 2016 on the Hong Kong Stock Exchange (stock code 1357.HK). For further information, please visit: https://www.meitu.com/en.

SOURCE Meitu

Share this article
Class (B2B/B2C)
B2B
Ingest Status
Rewritten
Dedupe hash
prn_302923373
Press Eligible
Yes
Press Eligible Reason
Manuelle Prüfung nötig. Risiko: MEDIUM. Flags: ['finance', 'numbers']. Stichprobe: False
Source Name
Unknown Company
Original Summary

<p>Meitu, Inc.(Stock Code: 1357.HK)2026 Investor Day Highlights Focused AI Innovation and Global "Scale-Up" HONG KONG, Oct. 29, 2026 /PRNewswire/ -- Meitu, Inc. (collectively, "Meitu" or "Company" and stock code: 1357.HK), a global leading provider of AI-powered photo, video, design and...</p>

Image URL
https://corp-static.meitu.com/corp-new/94a2d9857e7b02938814152c0e4a3810_1587114474.png
Content Hash (SHA-256, erste 32 hex)
cecd91890f4709ea4baad3fb47c54558
Arctic Wolf Named a Leader in 2026 QKS SPARK Matrix™ for AI SOC Automation
Image File
Original HTML

Recognition highlights how the Aurora® Agentic SOC combines specialized AI agents with human expertise to deliver trusted security outcomes

EDEN PRAIRIE, Minn., Oct. 29, 2026 /PRNewswire/ -- Arctic Wolf®, the cybersecurity and AI company, today announced it has been named a Leader in the Q4 2026 QKS SPARK Matrix⢠for AI SOC Automation. QKS Group also rated Arctic Wolf the highest vendor overall for customer service excellence, ease of deployment and use, and proven record. The recognition highlights how Arctic Wolf's Aurora Agentic SOC, which conducts more than 200,000 investigations weekly, helps organizations scale security operations by delivering trusted AI-driven security outcomes without the cost and complexity of building agentic security capabilities in-house.

Defining AI SOC Automation as "a security platform or set of solutions that uses artificial intelligence, machine learning, generative AI, and increasingly agentic AI to automate security operations activities across alert enrichment, triage, investigation, decision-making, and response," the QKS Group SPARK Matrix⢠analyzes market dynamics, competitive positioning, and technology leadership.

"Arctic Wolf has established a strong position in the AI SOC market through its focus on governed, agent-led security operations, delivered as a turnkey managed service," said Andrew Aken, Associate Vice President and Principal Advisor at QKS Group. "With continued investment in agent governance, integration velocity and customer-facing self-service, Arctic Wolf shows a strong combination of technology innovation and operational impact."

Trusted AI Security Operations Built on Governed AI

QKS Group highlighted Arctic Wolf's differentiated approach to delivering trusted AI-driven security operations. The report noted that Arctic Wolf has "a clearly articulated operating model" that replaces traditional tiered security workflows with a coordinated network of AI agents and human experts. The Aurora Agentic SOC, built on the Aurora® Superintelligence Platform, coordinates Arctic Wolf's patent-pending Swarm of Experts⢠framework, which revolutionizes how agentic actions are leveraged to deliver reliable security outcomes. The framework combines a large team of specialized AI agents with experienced Arctic Wolf security analysts, enabling rapid investigation and response while maintaining human oversight where it matters most.

QKS Group recognized how Arctic Wolf governs AI through its AI Trust Engineâ¢, which is designed to help make AI secure, explainable, and accountable. The report cited capabilities, including "asset-sensitive approval gates, adjustable confidence thresholds, and tiered handling that spans autonomous resolution to human-led decisions." QKS Group also noted Arctic Wolf's "auditable human control," adding that "change controls and blast-radius constraints reflect customer policies and asset criticality." Today, the Swarm of Experts resolves more than 60% of investigations autonomously, while built-in governance controls and human oversight ensure complex decisions receive additional validation before action is taken.

Driving Efficiency Gains Across Security Operations

QKS Group also highlighted how Arctic Wolf helps organizations improve operational efficiency and reduce analyst burden through AI-driven automation. According to QKS Group, the Aurora Agentic SOC "closes gaps through automated closure, deduplication, and contextual suppression, reducing the number of alerts that require analyst handling."

QKS Group further noted that Arctic Wolf "reduces mean time to triage and accelerates case resolution in production environments" and that "parallel agents assemble a case dossier, test evidence, and propose outcomes without requiring analysts to repeat research," helping security teams focus their time on higher-value decisions rather than repetitive manual work.

These efficiencies translate into measurable operational impact. According to Arctic Wolf, investigations are completed in as little as 12 seconds through the coordinated work of specialized AI agents.

Delivering Security Outcomes and Value at Scale

Beyond automation and efficiency, QKS Group recognized Arctic Wolf's ability to deliver measurable security outcomes through a managed approach to AI-driven security operations. According to QKS Group, Arctic Wolf is "well suited for organizations seeking a managed AI SOC that consolidates detection, investigation, and response across multi-vendor environments with predictable costs."

The report identifies the ideal customer as a "mid-market to enterprise program with a heterogeneous security stack, limited capacity to engineer and govern agents, and a desire to reduce triage load while accelerating response," underscoring Arctic Wolf's ability to help organizations adopt AI-driven security operations without adding operational complexity. Complementing this approach, the Aurora Agentic SOC deploys in as little as 10 days and is roughly 12 times more cost-effective than building and maintaining an agentic SOC internally. The report also highlighted Arctic Wolf's model that delivers value for its customers, noting that customers benefit from unlimited ingestion "because charges are not tied to events or investigations, cost exposure remains stable during alert storms."

This recognition reflects Arctic Wolf's continued investment in AI-native security operations and its mission to help organizations achieve better security outcomes with less operational burden. Through the Aurora Superintelligence Platform and Aurora Agentic SOC, Arctic Wolf combines trusted AI with human oversight to help customers scale security operations, strengthen cyber resilience, and stay ahead of an evolving threat landscape.

"Organizations need security operations that can move at machine speed, deliver outcomes they can trust, and do so without adding complexity," said Dan Schiappa, President of Technology and Services at Arctic Wolf. "The Aurora Agentic SOC was built to combine agentic AI with human oversight to help accelerate response and achieve better security outcomes at scale. That's what modern security operations requires in the age of AI."

To see why QKS Group named Arctic Wolf a Leader, explore the Aurora Agentic SOC.

Additional Resources

- Learn more about the Aurora Superintelligence Platform

- Learn more about the Aurora Agentic SOC

- Learn more about Aurora Managed Detection and Response

- Learn more about the Security Operations Warranty

- If you're ready to get started, request a demo

About Arctic Wolf

Arctic Wolf is the cybersecurity and AI company that ends cyber risk by transforming it into business resilience. Powered by the Aurora® Superintelligence Platform, Arctic Wolf delivers modern security operations built on proprietary AI and decades of real-world expertise. By combining AI-driven automation with expert-validated precision, Arctic Wolf helps organizations confidently manage cyber risk, so they can operate with control and the freedom to innovate. To learn more about Arctic Wolf, visit www.arcticwolf.com.

Media Contact

Oliver Cowley

Manager, Corporate Communications, Arctic Wolf

[email protected] 

© 2026 Arctic Wolf Networks, Inc. All Rights Reserved. Arctic Wolf, Aurora, Alpha AI, Arctic Wolf Security Operations Cloud, Arctic Wolf Managed Detection and Response, Arctic Wolf Managed Risk, Arctic Wolf Managed Security Awareness, Arctic Wolf Incident Response, and Arctic Wolf Concierge Security Team are either trademarks or registered trademarks of Arctic Wolf Networks, Inc.

About QKS Group

QKS Group is a global analyst and advisory firm helping enterprises, technology vendors, and investors make trusted, data-driven decisions. Our portfolio spans the flagship SPARK Matrix⢠evaluation framework, SPARK Plus⢠analyst advisory platform, QKS Intelligence⢠for market and competitive tracking, and QKS Community⢠for CXO leaders and practitioners. All offerings are powered by a Human-Intelligence-driven framework and QKS's closed-loop research methodology - integrating expert-led insights, quantitative modeling, and continuous validation to deliver credible, outcome-focused intelligence.

For more available research, please visit Research

Media Contacts:

Anish

PR & Media Relations

QKS Group

5th Floor, Wing 2, Cluster C, 

EON Free Zone, Kharadi,

Pune, India

Email: [email protected]

Content Source: https://qksgroup.com/newsroom/arctic-wolf-named-a-leader-in-2026-qks-spark-matrix-for-ai-soc-automation-1838 

Connect with us on LinkedIn- https://www.linkedin.com/company/qksgroup/ 

SOURCE QKS Group

Share this article

Class (B2B/B2C)
B2B
Ingest Status
Rewritten
Dedupe hash
prn_302923421
Press Eligible
Yes
Press Eligible Reason
Manuelle Prüfung nötig. Risiko: MEDIUM. Flags: ['numbers']. Stichprobe: False
Source Name
Unknown Company
Original Summary

<p>Recognition highlights how the Aurora® Agentic SOC combines specialized AI agents with human expertise to deliver trusted security outcomes EDEN PRAIRIE, Minn., Oct. 29, 2026 /PRNewswire/ -- Arctic Wolf®, the cybersecurity and AI company, today announced it has been named a Leader in the...</p>

Image URL
https://mmx.prnewswire.com/media/MS1596754/QKS-Group-Logo.jpg?id=OA3046973&p=facebook
Content Hash (SHA-256, erste 32 hex)
3c3bbf533b3001aba3def548c11fa27c
TAL Education Group Announces Unaudited Financial Results for the Second Fiscal Quarter Ended August 31, 2026, Declares Cash Dividend and Issues Notice of Annual General Meeting
Original HTML

TAL Education Group Announces Unaudited Financial Results for the Second Fiscal Quarter Ended August 31, 2026, Declares Cash Dividend and Issues Notice of Annual General Meeting

BEIJING, Oct. 29, 2026 /PRNewswire/ -- TAL Education Group (NYSE: TAL) ("TAL" or the "Company"), a smart learning solutions provider in China, today announced its unaudited financial results for the second quarter of fiscal year 2027 ended August 31, 2026 and issued notice of Annual General Meeting.

Highlights for the Second Quarter of Fiscal Year 2027

- Net revenues were US$994.6 million, compared to net revenues of US$861.4 million in the same period of the prior year.

- Income from operations was US$235.9 million, compared to income from operations of US$96.1 million in the same period of the prior year.

- Non-GAAP income from operations, which excluded share-based compensation expenses, was US$247.7 million, compared to non-GAAP income from operations of US$107.8 million in the same period of the prior year.

- Net loss attributable to TAL was US$47.4 million, compared to net income attributable to TAL of US$124.1 million in the same period of the prior year.

- Non-GAAP net loss attributable to TAL, which excluded share-based compensation expenses, was US$35.6 million, compared to non-GAAP net income attributable to TAL of US$135.8 million in the same period of the prior year.

- Basic and diluted net loss per American Depositary Share ("ADS") were both US$0.09. Non-GAAP basic and diluted net loss per ADS, which excluded share-based compensation expenses, were both US$0.06. Three ADSs represent one Class A common share.

- Cash, cash equivalents and short-term investments totaled US$2,748.5 million as of August 31, 2026, compared to US$3,239.3 million as of February 28, 2026.

Highlights for the Six Months Ended August 31, 2026

- Net revenues were US$1,753.0 million, compared to net revenues of US$1,436.4 million in the same period of the prior year.

- Income from operations was US$373.1 million, compared to income from operations of US$110.4 million in the same period of the prior year.

- Non-GAAP income from operations, which excluded share-based compensation expenses, was US$396.4 million, compared to non-GAAP income from operations of US$133.0 million in the same period of the prior year.

- Net income attributable to TAL was US$360.6 million, compared to net income attributable to TAL of US$155.4 million in the same period of the prior year.

- Non-GAAP net income attributable to TAL, which excluded share-based compensation expenses, was US$383.9 million, compared to non-GAAP net income attributable to TAL of US$177.9 million in the same period of the prior year.

- Basic and diluted net income per ADS were both US$0.65. Non-GAAP basic and diluted net income per ADS, which excluded share-based compensation expenses, were both US$0.69.

Financial DataââSecond Quarter and First Six Months of Fiscal Year 2027

(In US$ thousands, except per ADS data and percentages)

"In the second quarter of fiscal year 2027, we delivered steady revenue growth and continued to improve operational efficiency," said Alex Peng, TAL's President and Chief Financial Officer. "Our focus remains on strengthening our core businesses and delivering better learning experiences for students."

Mr. Peng added, "Looking ahead, we will continue to combine our educational expertise with technology to better serve students and create long-term value."

Financial Results for the Second Quarter of Fiscal Year 2027

Net Revenues

In the second quarter of fiscal year 2027, TAL reported net revenues of US$994.6 million, representing a 15.5% increase from US$861.4 million in the second quarter of fiscal year 2026.

Operating Costs and Expenses

In the second quarter of fiscal year 2027, operating costs and expenses were US$758.8 million, representing a 0.8% decrease from US$765.3 million in the second quarter of fiscal year 2026. Non-GAAP operating costs and expenses, which excluded share-based compensation expenses, were US$747.0 million, representing a 0.9% decrease from US$753.5 million in the second quarter of fiscal year 2026.

Cost of revenues increased by 8.0% to US$400.0 million from US$370.3 million in the second quarter of fiscal year 2026. Non-GAAP cost of revenues, which excluded share-based compensation expenses, increased by 8.0% to US$399.5 million, from US$369.8 million in the second quarter of fiscal year 2026.

Selling and marketing expenses decreased by 15.3% to US$226.4 million from US$267.3 million in the second quarter of fiscal year 2026. Non-GAAP selling and marketing expenses, which excluded share-based compensation expenses, decreased by 15.6% to US$223.3 million, from US$264.4 million in the second quarter of fiscal year 2026.

General and administrative expenses increased by 3.7% to US$132.4 million from US$127.6 million in the second quarter of fiscal year 2026. Non-GAAP general and administrative expenses, which excluded share-based compensation expenses, increased by 4.1% to US$124.2 million, from US$119.3 million in the second quarter of fiscal year 2026.

Total share-based compensation expenses allocated to the related operating costs and expenses increased by 0.7% to US$11.8 million in the second quarter of fiscal year 2027 from US$11.8 million in the same period of fiscal year 2026.

Gross Profit

Gross profit increased by 21.1% to US$594.6 million from US$491.0 million in the second quarter of fiscal year 2026. The gross margin for the second quarter of fiscal year 2027 was 59.8%, compared to 57.0% in the same period of the prior year.

Income from Operations

Income from operations was US$235.9 million in the second quarter of fiscal year 2027, compared to income from operations of US$96.1 million in the second quarter of fiscal year 2026. Non-GAAP income from operations, which excluded share-based compensation expenses, was US$247.7 million, compared to Non-GAAP income from operations of US$107.8 million in the same period of the prior year.

Other Income/(Expense)

Other expense was US$189.7 million for the second quarter of fiscal year 2027, compared to other income of US$67.1 million in the second quarter of fiscal year 2026. The change in other income/(expense) for the second quarter was mainly driven by fluctuations in the fair value of certain investments.

Income Tax Expense

Income tax expense was US$135.9 million in the second quarter of fiscal year 2027, compared to US$51.1 million of income tax expense in the second quarter of fiscal year 2026. The increase in income tax expense was mainly due to changes in deferred tax liabilities relating to withholding tax.

Net Income/(Loss) Attributable to TAL Education Group

Net loss attributable to TAL was US$47.4 million in the second quarter of fiscal year 2027, compared to net income attributable to TAL of US$124.1 million in the second quarter of fiscal year 2026. Non-GAAP net loss attributable to TAL, which excluded share-based compensation expenses, was US$35.6 million, compared to Non-GAAP net income attributable to TAL of US$135.8 million in the second quarter of fiscal year 2026.

Basic and Diluted Net Income/(Loss) per ADS

Basic and diluted net loss per ADS were both US$0.09 in the second quarter of fiscal year 2027. Non-GAAP basic and diluted net loss per ADS, which excluded share-based compensation expenses, were both US$0.06 in the second quarter of fiscal year 2027.

Cash Flow

Net cash used in operating activities for the second quarter of fiscal year 2027 was US$179.1 million.

Cash, Cash Equivalents, and Short-term Investments

As of August 31, 2026, the Company had US$1,952.6 million of cash and cash equivalents and US$795.9 million of short-term investments, compared to US$1,523.9 million of cash and cash equivalents and US$1,715.4 million of short-term investments as of February 28, 2026.

Deferred Revenue

As of August 31, 2026, the Company's deferred revenue balance was US$930.4 million, compared to US$882.2 million as of February 28, 2026.

Financial Results for the First Six Months of Fiscal Year 2027

Net Revenues

For the first six months of fiscal year 2027, TAL reported net revenues of US$1,753.0 million, representing a 22.0% increase from US$1,436.4 million in the first six months of fiscal year 2026.

Operating Costs and Expenses

In the first six months of fiscal year 2027, operating costs and expenses were US$1,380.0 million, representing a 4.1% increase from US$1,325.9 million in the first six months of fiscal year 2026. Non-GAAP operating costs and expenses, which excluded share-based compensation expenses, were US$1,356.6 million, representing a 4.1% increase from US$1,303.4 million in the first six months of fiscal year 2026.

Cost of revenues increased by 14.3% to US$720.2 million from US$629.9 million in the first six months of fiscal year 2026. Non-GAAP cost of revenues, which excluded share-based compensation expenses, increased by 14.4% to US$719.2 million from US$628.8 million in the first six months of fiscal year 2026.

Selling and marketing expenses decreased by 11.1% to US$398.4 million from US$448.1 million in the first six months of fiscal year 2026. Non-GAAP selling and marketing expenses, which excluded share-based compensation expenses, decreased by 11.2% to US$392.6 million from US$442.1 million in the first six months of fiscal year 2026.

General and administrative expenses increased by 5.4% to US$261.3 million from US$247.9 million in the first six months of fiscal year 2026. Non-GAAP general and administrative expenses, which excluded share-based compensation expenses, increased by 5.3% to US$244.9 million from US$232.5 million in the first six months of fiscal year 2026.

Total share-based compensation expenses allocated to the related operating costs and expenses increased by 3.8% to US$23.4 million in the first six months of fiscal year 2027 from US$22.5 million in the same period of fiscal year 2026.

Gross Profit

Gross profit increased by 28.1% to US$1,032.

Class (B2B/B2C)
B2B
Ingest Status
Rewritten
Dedupe hash
prn_302923409
Press Eligible
Yes
Press Eligible Reason
Manuelle Prüfung nötig. Risiko: MEDIUM. Flags: ['finance', 'numbers']. Stichprobe: False
Source Name
Unknown Company
Original Summary

<p>BEIJING, Oct. 29, 2026 /PRNewswire/ -- TAL Education Group (NYSE: TAL) ("TAL" or the "Company"), a smart learning solutions provider in China, today announced its unaudited financial results for the second quarter of fiscal year 2027 ended August 31, 2026 and issued notice of Annual...</p>

Content Hash (SHA-256, erste 32 hex)
d1c4af6f5e5a72c1ef9f217de473e8cf
U&I Ventures Closes Oversubscribed $32.237M Debut Fund, Taps 1,800 Tech Leaders to Shape Its Investment Strategy to Secure AI
Image File
Original HTML

Founded by investor Kim Moore, the firm has already backed nine AI-native engineering and security software startups, helping founders build products informed by enterprise demand while accelerating their path to market.

SAN FRANCISCO, Oct. 29, 2026 /PRNewswire/ -- U&I Ventures today announced the oversubscribed final close of its $32.237 million debut fund to back seed-stage founders building AI-native infrastructure within security, engineering and IT. The firm is built around a community of 1,800 CIOs, CTOs and CISOs who understand where enterprise technology is breaking and help U&I-backed founders build what the enterprise needs.

The approach is already delivering results. U&I connected Pluto Security founder and CEO Shahar Bahat with 68 enterprise CISOs in less than 24 hours during the company's oversubscribed seed round. Another portfolio company in stealth that tests and evaluates autonomous AI agents in production environments secured initial pilot deployments at Fortune 20 enterprises through U&I's network.

"I spent years asking founders what they needed beyond capital, and the answer was always access to the right people," said Kim Moore, Founder and General Partner of U&I Ventures. "That is the foundation for U&I. Our network has a seat at the investing table and helps us understand what enterprises need before we invest. This value-add flywheel gives founders direct access to the people who can shape, validate, and ultimately adopt what they're building."

Turning Enterprise Challenges Into Investment Opportunities

U&I's investment model was years in the making. Before launching the firm, Moore spent more than a decade building relationships with enterprise technology leaders, learning firsthand about the infrastructure engineering gaps, security vulnerabilities and operational challenges they faced.

Today, U&I convenes weekly, closed-door discussions with technology leaders across San Francisco, New York, Tel Aviv and London. Its network includes nearly 650 CISOs and security executives, 850 CTOs and more than 300 CIOs, whose insights help inform investment decisions while giving founders access to product feedback, industry expertise and prospective customers.

These longstanding relationships give U&I an advantage at both ends of the investment process, helping the firm identify opportunities grounded in real-world needs while enabling startups to develop products with early input from potential customers.

Fund I plans to back 40 to 45 pre-seed and seed-stage companies, with initial checks ranging from $250,000 to more than $800,000. The firm has made nine investments across AI security, agent reliability, compliance and enterprise infrastructure, including:

- Pluto Security: Securing enterprise adoption of AI coding and application-building platforms (seed round led by TLV Partners). Pluto Security has raised a total of $42 million across two funding rounds as it emerged from stealth in October 2026.

- ZeroDrift: Real-time visibility and control for every AI compliance decision. Monitor, approve, block, and export evidence across all AI communication surfaces (backed by a16z speedrun).

Seven additional stealth investments address autonomous vulnerability remediation, agentic digital forensics, identity management, security operations, testing and evaluating autonomous AI agents in production environments, and AI data infrastructure.

"U&I has been by far our most helpful investor," said Kumesh Armoogan, Founder and CEO of ZeroDrift.

"As companies deploy more autonomous AI systems, they're facing security challenges that existing tools weren't designed to handle," said Alex Stamos, Chief Security Officer at Cognition and former Chief Security Officer at Facebook and Yahoo. "The technology leaders responsible for securing these systems know firsthand where the gaps are. By bringing those leaders together with founders early, U&I is helping turn real-world security challenges into solutions enterprises actually need."

Before launching U&I, Moore spent over a decade at Glynn Capital and Innovation Endeavors, backing enterprise infrastructure companies including Chronosphere and Drata. She was employee No. 23 at Asana . Her earlier investments include security startups Fig Security and Mate Security, which subsequently raised Series A financing. Read more on why Moore founded U&I here.

About U&I Ventures

U&I Ventures is a San Francisco-based seed-stage venture capital firm investing in AI-native infrastructure across security, engineering and IT. Founded in 2025 by Kim Moore, the firm manages a $32.237 million debut fund and draws on a network of 1,800 CIOs, CTOs and CISOs to identify emerging enterprise needs and help portfolio companies build, validate and bring their technologies to market. Founding Operating Partner Kim Cooper leads the firm's operator community and value creation platform. For more information, visit uandi.vc. Connect with us on LinkedIn at U&I Ventures.

This press release is for informational purposes only and does not constitute an offer to sell, or a solicitation of an offer to buy, any interest in any fund or investment vehicle managed by U&I Ventures. Any such offer may be made only through definitive offering documents to qualified investors. References to portfolio companies are for illustrative purposes only, do not represent all investments made by U&I Ventures, and should not be considered an indication of future results.

Media Contact:

[email protected]

SOURCE U&I Ventures

Share this article

Class (B2B/B2C)
B2B
Ingest Status
Need Review
Dedupe hash
prn_302923041
Press Eligible
Yes
Press Eligible Reason
QA FAIL (need review): The TARGET contains contradictory/incorrect numbers: 'checks up to $800,000' should be 'more than $800,000' per SOURCE, and 'a decade' heading should be 'more than a decade' (body later corrects it). These are partial inaccuracies requiring correction.
Source Name
Unknown Company
Original Summary

<p>Founded by investor Kim Moore, the firm has already backed nine AI-native engineering and security software startups, helping founders build products informed by enterprise demand while accelerating their path to market. SAN FRANCISCO, Oct. 29, 2026 /PRNewswire/ -- U&amp;I Ventures today...</p>

Image URL
https://mmx.prnewswire.com/media/MS2023205/UI-Ventures-Team-Photo-UandI.jpg?id=OA3046324&p=facebook
Generated Article_json
{"target_audience": "b2b", "is_medical": false, "ai_generated_title": "U&I Ventures Closes Oversubscribed $32.2M Debut AI Infrastructure Fund", "body_html": "<p><strong>San Francisco -- [CURRENT_DATE] --</strong> U&I Ventures has closed its debut fund at $32.237 million, oversubscribed, to back seed-stage founders building AI-native infrastructure in security, engineering and IT.</p><p>The firm has already made nine investments. Its model rests on a network of 1,800 CIOs, CTOs and CISOs that screens enterprise pain points before checks are written.</p><h5>Fund I targets 40 to 45 pre-seed and seed companies with checks up to $800,000</h5><p>Initial checks range from $250,000 to more than $800,000. The nine portfolio companies span AI security, agent reliability, compliance and enterprise infrastructure.</p><p>Two are named. Pluto Security secures enterprise adoption of AI coding and application-building platforms; its seed round was led by TLV Partners. The company has raised $42 million across two rounds and emerged from stealth in October 2026. ZeroDrift offers real-time visibility and control over AI compliance decisions across AI communication surfaces and is backed by a16z speedrun.</p><p>Seven further investments remain in stealth. They address autonomous vulnerability remediation, agentic digital forensics, identity management, security operations, testing of autonomous AI agents in production, and AI data infrastructure.</p><h5>U&I connected Pluto's CEO with 68 CISOs in under 24 hours</h5><p>During Pluto's oversubscribed seed round, U&I introduced founder and CEO Shahar Bahat to 68 enterprise CISOs in less than 24 hours. A stealth portfolio company that tests and evaluates autonomous AI agents in production secured initial pilot deployments at Fortune 20 enterprises through the same network.</p><p>Founder and General Partner Kim Moore said the network \"has a seat at the investing table\" and helps U&I understand enterprise needs before it invests.</p><h5>Weekly closed-door sessions span four cities and nearly 1,800 executives</h5><p>U&I convenes weekly closed-door discussions with technology leaders in San Francisco, New York, Tel Aviv and London. The network includes nearly 650 CISOs and security executives, 850 CTOs and more than 300 CIOs. Their input shapes investment decisions and gives founders product feedback and access to prospective customers.</p><p>Alex Stamos, Chief Security Officer at Cognition and former security chief at Facebook and Yahoo, said companies deploying more autonomous AI systems face security challenges that existing tools were not designed to handle. ZeroDrift founder and CEO Kumesh Armoogan called U&I \"by far our most helpful investor.\"</p><h5>Moore brings a decade at Glynn Capital and Innovation Endeavors</h5><p>Before founding U&I in 2025, Moore spent more than a decade at Glynn Capital and Innovation Endeavors, backing enterprise infrastructure companies including Chronosphere and Drata. She was employee No. 23 at Asana. Her earlier investments include security startups Fig Security and Mate Security, both of which subsequently raised Series A financing. Founding Operating Partner Kim Cooper leads the firm's operator community and value creation platform.</p>", "meta_description": "U&I Ventures closes its oversubscribed $32.237M debut fund to back 40-45 seed-stage AI-native security, engineering and IT startups via a 1,800-executive network.", "seo_keywords": "U&I Ventures, seed fund, AI-native infrastructure, AI security, venture capital, Kim Moore, Pluto Security, ZeroDrift, CISO network", "companies": ["U&I Ventures", "Pluto Security", "ZeroDrift"], "industries": ["Finance & Investment"], "markets_regions": ["United States"], "news_type": ["financial_disclosure", "funding_announcement"], "products": [], "themes": ["venture_capital", "ai_security", "enterprise_technology"], "events": [], "cta_text": "Learn more about U&I Ventures and its Fund I investment focus", "learn_more": "", "fact_check": {"accuracy_score": 100, "legal_risk": "low", "corrections_made": [], "recommendation": "publish"}}
Content Hash (SHA-256, erste 32 hex)
a8c483399964ea4934aaa0c48777c193
New NWEA Study Finds Low-Income Students Underrepresented Among High Achievers and More Likely to Lose Ground
Image File
Original HTML

Despite making up more than half of the U.S. student population, lower-income students account for just 20% of top math achievers

BOSTON, Oct. 29, 2026 /PRNewswire/ -- NWEA, a K-12 assessment and research organization, released today a new study examining the representation of low-income students among high achievers compared to their higher-income peers. The study also looked at low-income students who entered elementary school as high achievers to see if they remain high-achieving as they progress through school.

Using MAP Growth math test scores from nearly one million U.S. students between 2021 and 2025, the study found:

- Lower-income students make up more than half of the U.S. student population but account for only 20% of high achievers (e.g., students scoring at or above the 95th percentile).

- Lower-income elementary students were also more likely to lose their high achiever status as they moved across grade levels. Among initially high-achieving kindergarteners, only 26% of lower-income students were still high-achieving by 4th grade, compared to 41% of higher-income students.

- Lower-income students who dropped out of the high-achieving group remained in the top 20% of the score distribution, but tended to fall a little bit farther than their higher-income peers.

The findings highlight an often-overlooked dimension of educational equity: ensuring that academically advanced students from lower-income backgrounds are identified, challenged and supported so they can continue to excel.

"Our findings highlight that there are many lower-income students with the potential to score at the very top of the distribution in math," said Dr. Megan Kuhfeld, Director of Growth Modeling and Data Analytics at NWEA. "However, the challenge is whether we identify their ability early and then consistently provide the opportunities and support they need to sustain it."

The study recommends treating advanced achievement as an equity issue, and encourages schools and districts to respond by:

- Expanding their advanced math learning identification systems that recognize high achievement within school contexts.

- More closely monitoring access to advanced opportunities across the span of a student's academic journey rather than a one-time chance to be classified as high-achieving.

- Ensuring consistent access to challenging math opportunities for lower-income students

Read the full research brief: https://www.nwea.org/research/publication/missing-at-the-top-lower-income-students-underrepresented-among-high-achievers/

About NWEA

NWEA®, a division of HMH, supports educators worldwide by providing responsive, evidence-based assessment solutions that illuminate learning needs and fuel student growth. For more than 40 years, NWEA has developed innovative pre-Kâ12 assessments, including its flagship assessment â MAP Growth â and professional learning that helps educators strengthen their practice and improve student outcomes. As part of its commitment to bring valuable insights to the education community, NWEA engages in research that examines issues that shed light on inequities and other barriers to academic opportunities. Visit NWEA.org to find out how NWEA partners to help all kids learn.

Contact: Simona Beattie, Communications Director, [email protected] or 971.361.9526

SOURCE NWEA

Share this article

Class (B2B/B2C)
B2B
Ingest Status
Need Review
Dedupe hash
prn_302922879
Press Eligible
Yes
Press Eligible Reason
QA FAIL (need review): The final paragraph is a generic corporate description ('NWEA is a division of HMH.') that adds no news context and does not summarize or naturally integrate into the story, constituting a PR-boilerplate ending.
Source Name
Unknown Company
Original Summary

<p>Despite making up more than half of the U.S. student population, lower-income students account for just 20% of top math achievers BOSTON, Oct. 29, 2026 /PRNewswire/ -- NWEA, a K-12 assessment and research organization, released today a new study examining the representation of low-income...</p>

Image URL
https://mmx.prnewswire.com/media/MS1062516/NWEA-Logo-Logo.jpg?id=OA3045785&p=facebook
Generated Article_json
{"target_audience": "b2b", "is_medical": false, "ai_generated_title": "NWEA: Lower-Income Students Are 20% of Top Math Achievers", "body_html": "<p><strong>BOSTON -- [CURRENT_DATE] --</strong> Lower-income students make up more than half of the U.S. student population but only 20% of high achievers in math, according to a new study from assessment and research organization NWEA.</p><p>The research drew on MAP Growth math scores from nearly one million U.S. students between 2021 and 2025. NWEA defined high achievers as students scoring at or above the 95th percentile. It also tracked low-income students who entered elementary school as high achievers to see whether they kept that status.</p><h5>Lower-income high achievers lose their status faster than higher-income peers</h5><p>Among kindergarteners who started as high achievers, only 26% of lower-income students were still in that group by 4th grade. The figure for higher-income students was 41%.</p><p>Lower-income students who dropped out of the high-achieving group stayed in the top 20% of the score distribution. They tended to fall somewhat farther than higher-income peers who dropped out.</p><h5>NWEA's Kuhfeld says early identification must be followed by sustained support</h5><p>Dr. Megan Kuhfeld, Director of Growth Modeling and Data Analytics at NWEA, said many lower-income students have the potential to score at the very top in math. The open question, she said, is whether schools identify that ability early and then consistently provide the opportunities and support needed to sustain it.</p><h5>Study urges schools to treat advanced achievement as an equity issue</h5><p>The study recommends that schools and districts take three steps:</p><ul><li>Expand advanced math identification systems that recognize high achievement within school contexts.</li><li>Monitor access to advanced opportunities across a student's full academic journey, rather than relying on a one-time classification as high-achieving.</li><li>Ensure consistent access to challenging math opportunities for lower-income students.</li></ul><p>NWEA is a division of HMH.</p>", "meta_description": "NWEA study of nearly 1M students finds lower-income pupils are over half of U.S. enrollment but just 20% of top math achievers, and lose high-achiever status faster.", "seo_keywords": "NWEA, MAP Growth, math achievement, educational equity, lower-income students, high achievers, K-12 assessment, U.S. education", "companies": ["NWEA", "HMH"], "industries": ["Education"], "markets_regions": ["United States"], "news_type": ["research_report"], "products": ["MAP Growth"], "themes": ["educational_equity", "student_assessment"], "events": [], "cta_text": "Read the full NWEA research brief on lower-income students among high achievers", "learn_more": "https://www.nwea.org/research/publication/missing-at-the-top-lower-income-students-underrepresented-among-high-achievers/", "fact_check": {"accuracy_score": 100, "legal_risk": "low", "corrections_made": ["Used the [CURRENT_DATE] placeholder in the dateline instead of the source date, per the system rules", "Removed the PR boilerplate and contact block"], "recommendation": "publish"}}
Content Hash (SHA-256, erste 32 hex)
b2b5d0fdee9f18521cf7debf59be587a
Integrierte kommunale Schulden steigen im Jahr 2025 um 9,9 %
Original HTML

Integrierte kommunale Schulden steigen im Jahr 2025 um 9,9 %

WIESBADEN (ots)

- Integrierte kommunale Verschuldung Ende 2025 bei 4 907 Euro pro Kopf

- Höchste kommunale Pro-Kopf-Verschuldung in Hessen, zweithöchste im Saarland

- Höchster Anstieg der integrierten kommunalen Schulden in Niedersachsen (+13,3 %), geringster Anstieg im Saarland (+2,3 %)

Die Schulden der Gemeinden und Gemeindeverbände einschließlich ihrer Beteiligungen beim nicht-öffentlichen Bereich stiegen nach einer Modellrechnung der Statistischen Ämter des Bundes und der Länder zum Jahresende 2025 gegenüber dem Jahresanfang um 9,9 %. Im Vorjahr hatte der Anstieg 6,3 % betragen. Für die integrierten kommunalen Schulden werden neben den Schulden der kommunalen Kernhaushalte auch die Schulden der Extrahaushalte und sonstigen öffentlichen Fonds, Einrichtungen und Unternehmen bis in tiefe Beteiligungsstufen abgebildet und den Kommunen zugeordnet. Wie das Statistische Bundesamt (Destatis) weiter mitteilt, ergab sich so zum Jahresende 2025 insgesamt ein kommunales Schuldenvolumen von 378,9 Milliarden Euro oder 4 907 Euro pro Kopf.

Der Anstieg der Gesamtverschuldung nach der integrierten Modellrechnung ist wie im Vorjahr vor allem auf den deutlichen Schuldenaufbau der kommunalen Kern- und Extrahaushalte (+15,5 % bzw. +14,7 %) zurückzuführen. Diese wiesen 2025 im zweiten Jahr in Folge ein Rekorddefizit auf (siehe Pressemitteilung Nr. 114 vom 1. April 2026). Die Schulden der Beteiligungen an sonstigen öffentlichen Fonds, Einrichtungen und Unternehmen wuchsen im Vorjahresvergleich um 4,5 %.

Pro-Kopf-Verschuldung in Hessen am höchsten, in Brandenburg am geringsten

Die Gemeinden und Gemeindeverbände in Hessen waren nach der Modellrechnung der integrierten Schulden Ende 2025 mit 6 763 Euro pro Kopf am stärksten verschuldet. Durch einen Anstieg von 7,4 % vergrößerten die hessischen Kommunen den Abstand zu den saarländischen Kommunen (6 408 Euro pro Kopf), die noch Ende 2023 die höchste Pro-Kopf-Verschuldung aufgewiesen hatten.

Die geringsten Schuldenniveaus pro Kopf wiesen Ende 2025 die Kommunen in Brandenburg (2 733 Euro), Sachsen (3 338 Euro) und Thüringen (3 692 Euro) auf.

Höchste Anstiege in Niedersachsen und Baden-Württemberg

Die integrierten kommunalen Schulden stiegen 2025 in allen Bundesländern. Der Anstieg war in Niedersachsen (+13,3 %) und in Baden-Württemberg (+13,1 %) am höchsten. Danach folgen Schleswig-Holstein mit +11,5 % und Bayern mit +11,1 %. Diese beiden Länder hatten auch im Vorjahr hohe Zuwächse, bleiben aber mit ihrer Pro-Kopf-Verschuldung (4 166 Euro bzw. 3 851 Euro) deutlich unter dem Bundesdurchschnitt.

In Rheinland-Pfalz stiegen die integrierten kommunalen Schulden nach einem Rückgang im Vorjahr (-10,2 %) wieder um 8,3 %. 2025 wurde im Gegensatz zu 2024 nur noch ein geringes Volumen an kommunalen Liquiditätskrediten über das Landesprogramm "Partnerschaft zur Entschuldung der Kommunen in Rheinland-Pfalz" (PEK-RP) vom Land übernommen.

Geringste Anstiege im Saarland und Thüringen

Das Saarland hatte unter allen Bundesländern den geringsten Anstieg (+2,3 %), gefolgt von Thüringen (+2,9 %). Im Rahmen des Saarlandpakts wurden weiterhin Kassenkredite der kommunalen Kernhaushalte vom Land übernommen. Die Gesamtentwicklung Thüringens erklärt sich vor allem daraus, dass es das einzige Bundesland mit einem Rückgang der Kernhaushaltsschulden ist (-5,3 %).

Einen kompakten Überblick zur Entwicklung in den Bundesländern gibt die Tabelle "Integrierte kommunale Schulden beim nicht-öffentlichen Bereich am 31.12.2025". Ausführliche Ergebnisse bietet die Bund-Länder-Veröffentlichung "Integrierte Schulden der Gemeinden und Gemeindeverbände" auf der Themenseite "Schulden, Finanzvermögen" im Internetangebot des Statistischen Bundesamtes.

Methodische Hinweise:

Die Modellrechnung der Statistischen Ämter des Bundes und der Länder bezieht zusätzlich zu den Schulden der kommunalen Kern- und Extrahaushalte auch die Schulden der sonstigen öffentlichen Fonds, Einrichtungen und Unternehmen ein, an denen die Kommunen unmittelbar oder mittelbar beteiligt sind. Dies ermöglicht einen von Ausgliederungsentscheidungen unabhängigen Vergleich. Eine Aussage zu kommunalen Haftungsrisiken - also dazu, für welche Schulden eine Kommune haftungsrechtlich in Verantwortung gezogen werden kann - kann aus der Modellrechnung der integrierten kommunalen Schulden nicht abgeleitet werden. Eine Gegenüberstellung mit den kommunalen Vermögen ist wegen fehlender Angaben zu den sonstigen öffentlichen Fonds, Einrichtungen und Unternehmen nicht möglich.

Es werden ausschließlich die Schulden beim nicht-öffentlichen Bereich (Kreditinstitute, sonstige inländischer und ausländischer Bereich, zum Beispiel private Unternehmen) in die Berechnung einbezogen. Schulden von nicht-mehrheitlich öffentlich bestimmten Einheiten beziehungsweise von Einheiten mit Sitz im Ausland werden statistisch nicht erhoben und gehen daher nicht in die Modellrechnung ein.

Die Stadtstaaten Bremen, Berlin und Hamburg sind in den Ergebnissen nicht enthalten, da sie in den amtlichen Finanzstatistiken der Länderebene zugeordnet werden, nicht der kommunalen Ebene.

Die Veränderungsraten der Schulden werden jeweils zum Anfangsbestand am 1. Januar eines Jahres berechnet und beziehen sich auf eine konstante Grundgesamtheit.

Der auf Basis der Beteiligungsverhältnisse errechnete aggregierte kommunale Schuldenstand ist - mit Ausnahme der Kernhaushaltsschulden - nicht vergleichbar mit dem der nach Vorgaben der Europäischen Union erstellten Schuldenstatistik (siehe dazu Pressemitteilung Nr. 267 vom 29. Juli 2026).

Weitere Informationen:

Detaillierte Ergebnisse auf Gemeindeebene und methodische Erläuterungen enthält die Bund-Länder-Veröffentlichung "Integrierte Schulden der Gemeinden und Gemeindeverbände" für 2025. Diese steht auch im gemeinsamen Statistikportal der Statistischen Ämter des Bundes und der Länder zum Download zur Verfügung. Die interaktive Anwendung zu den integrierten kommunalen Schulden bereitet Ergebnisse für die Kreis- und Verbandsgemeindeebene auf. Daten zur Entwicklung in den Bundesländern bietet auch die Tabelle "Integrierte kommunale Schulden beim nicht-öffentlichen Bereich am 31.12.2025" auf der Themenseite "Schulden, Finanzvermögen" im Internetangebot des Statistischen Bundesamtes.

Diese Pressemitteilung ist, gegebenenfalls ergänzt mit weiteren Informationen und Verlinkungen zum Thema, veröffentlicht unter www.destatis.de/pressemitteilungen.

Weitere Auskünfte:

Öffentliche Schulden, öffentliches Vermögen

Telefon: +49 611 75 4099

www.destatis.de/kontakt

Pressekontakt:

Statistisches Bundesamt

Pressestelle

www.destatis.de/kontakt

Telefon: +49 611-75 34 44

Original-Content von: Statistisches Bundesamt, übermittelt durch news aktuell

Class (B2B/B2C)
B2B
Ingest Status
Rewritten
Dedupe hash
pp_6379926
Press Eligible
Yes
Press Eligible Reason
Manuelle Prüfung nötig. Risiko: MEDIUM. Flags: ['finance', 'numbers']. Stichprobe: False
Source Name
Unknown Company
Original Summary

Statistisches Bundesamt: WIESBADEN (ots) - - Integrierte kommunale Verschuldung Ende 2025 bei 4 907 Euro pro Kopf - Höchste kommunale Pro-Kopf-Verschuldung in Hessen, zweithöchste im Saarland - Höchster Anstieg der integrierten kommunalen Schulden in Niedersachsen (+13,3 ...

Content Hash (SHA-256, erste 32 hex)
b047e655b4fab5d673c5d25f11aec03b
Wo die Tiroler Krippenkunst ihren Anfang nahm
Image File
Original HTML

Wo die Tiroler Krippenkunst ihren Anfang nahm

Region Hall-Wattens (ots)

In drei Orten der Region Hall-Wattens gibt es alle Jahre wieder zur Weihnachtszeit einen Schatz zu bestaunen: Die drei ältesten Krippen Österreichs.

Diese besonderen Krippen können auch beim sogenannten „Krippeleschaug’n“ bewundert werden.

Tulfer Dorfkrippe: Wo Hirten Lederhosen tragen

Die Dorfkrippe in Tulfes ist weit mehr als eine biblische Darstellung, sondern ein kulturhistorisches Unikat. Die kunstvoll aus Holz geschnitzten Gliederpuppen beeindrucken durch ihre beweglichen Arme und Füße. Ein besonderes Detail: Die Hirtenfiguren sind nicht etwa orientalisch gewandet, sondern tragen die traditionelle Tiroler Tracht inklusive Lederhosen.

Der Tulfer Krippenschatz wird jedes Jahr vor dem dritten Adventsonntag aufgestellt und ist bis kurz vor dem Sebastianitag am 20.01. zu sehen. Ein „Geheimtipp“: Das Jesukind in der Pfarrkirche Tulfes ist immer ab dem 24.12. zu bewundern.

Die drei ältesten Krippen in Mitteleuropa

Auch die Krippe der Jesuitenkirche in Hall (1609) zählt zu den ältesten Krippen in Mitteleuropa, genauso wie die älteste noch erhaltene, private Krippe am Maxnhof in Thaur, die auf die erste Hälfte des 17. Jahrhunderts zurückdatiert wird.

UNESCO Immaterielles Weltkulturerbe: Das „Krippeleschaug’n“

In der Weihnachtszeit können auch Gäste diese besonderen Kunstwerke erleben: Beim traditionellen „Krippele schauen“. Eine Tradition in der Region Hall-Wattens, die seit dem Jahr 2021 Immaterielles Weltkulturerbe ist. In mehreren Häusern öffnen Einheimische ihre Türen und laden bei der geführten Krippentour dazu ein, die kunstvoll gefertigten Krippen zu sehen. Den Besucher*innen bei einem Plausch ein „Gloriawasser“ und auch Selbstgebackenes zu servieren - das ist Ehrensache. Ab ca. 22.12.2026 findet das Krippeleschaug’n in verschiedenen Orten der Region statt. Alle Infos und Termine unter: www.hall-wattens.at/krippen

Drei Tage Auszeit vor Weihnachten

Zwei Übernachtungen, eine Stadtführung in Hall in Tirol, ein Heißgetränk am Haller Adventmarkt inkl. Adventtasse, ein Eintritt in das Museum Münze Hall sowie in die Swarovski Kristallwelten. Buchbar von 20.11. bis 23.12.2026 ab Ꞓ 135.- p.P. unter www.hall-wattens.at/advent

Die ältesten Krippen Österreichs Jetzt mehr erfahren

Pressekontakt:

Hall-Wattens Tourismus

Leonie Lassl

Telefon: +43 5223 45544-32

E-Mail: l.lassl@hall-wattens.at

Original-Content von: TVB Region Hall-Wattens, übermittelt durch news aktuell

Class (B2B/B2C)
B2C
Ingest Status
Rewritten
Dedupe hash
pp_6379943
Press Eligible
Yes
Press Eligible Reason
Manuelle Prüfung nötig. Risiko: MEDIUM. Flags: ['finance']. Stichprobe: False
Source Name
Unknown Company
Original Summary

TVB Region Hall-Wattens: Region Hall-Wattens (ots) - In drei Orten der Region Hall-Wattens gibt es alle Jahre wieder zur Weihnachtszeit einen Schatz zu bestaunen: Die drei ältesten Krippen Österreichs. Diese besonderen Krippen können auch beim sogenannten ...

Image URL
https://cache.pressmailing.net/thumbnail/highlight/d0b72218-b7ec-4c65-bd2b-86740dde4bda/20261029-ONA0002-1-1.jpg?crop=51,0,630,412
Content Hash (SHA-256, erste 32 hex)
6e969d8cd03fea0bbdd5db7311010571
Studie: Frustration an deutschen Schulen über Digitalisierung ohne Konzept
Image File
Original HTML

Studie: Frustration an deutschen Schulen über Digitalisierung ohne Konzept

Düsseldorf (ots)

- Deutsche Schulen haben in die Einführung von digitalen Medien und Anwendungen investiert, aber sich nicht ausreichend mit dem Lernnutzen beschäftigt

- 59 % der befragten Lehrkräfte und 67 % der IT-Verantwortlichen geben an, dass schneller in digitale Geräte sowie Anwendungen investiert wurde, als sie eine sinnvolle pädagogische Anwendung im Unterricht finden

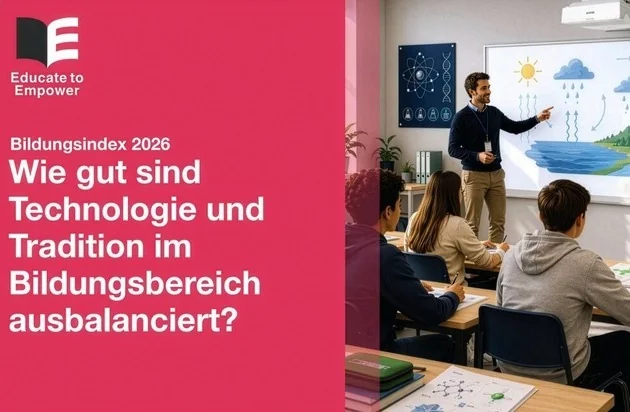
- Deutschland erreicht 5,1 von 10 Punkten beim "Educate to Empower Index". Dieser gibt an, wie gut neue technologische Lösungen und traditionellere Lernmittel ausbalanciert sind.

Eine neue Studie, die Epson unter Schüler:innen, Lehrkräften sowie IT-Verantwortlichen an Schulen in sechs europäischen Bildungsmärkten in Auftrag gegeben hat, offenbart eine Diskrepanz zwischen der Menge der in den Klassenzimmern vorhandenen Technologie und ihrem pädagogischen Nutzen.

Technologie ist aus unserem Alltag nicht wegzudenken. In Deutschland geben 86 % der Schüler:innen an, digitale Geräte und Anwendungen in fast allen Lebensbereichen zu nutzen. Dementsprechend ist es nicht verwunderlich, dass 68 % erwarten, diese auch im Unterricht nutzen zu können. Damit liegen die deutschen Schüler:innen im Ländervergleich deutlich vorne: im Durchschnitt fordern dies 58 % der Schüler:innen aus den befragten sechs Ländern.

Das deutsche Bildungssystem hat darauf reagiert: 83 % der IT-Verantwortlichen an Schulen stimmen zu, dass ihre Schulen im vergangenen Jahr mehr Technologie eingeführt haben. Auch hier liegt Deutschland über dem Durchschnitt (67 %) der untersuchten Bildungsmärkte. Das nationale Engagement spiegelt sich in den Ausgaben auf EU-Ebene wider: Insgesamt hat die EU über 23 Milliarden Euro in Bildungstechnologie und digitale Kompetenzen investiert.

Der Mitteleinsatz schlägt sich aber laut neuesten Untersuchungen nicht immer in besseren Lernleistungen wieder. Die Ergebnisse aus dem letzten PISA-Test der OECD haben gezeigt, dass die globalen Leistungen in Mathematik und Lesekompetenz deutlich gesunken sind.

Ein Großteil der Lehrkräfte (63 %) sagt, dass neue Technologien in der breiten Masse zwar schnell angenommen werden, sie aber von vielen noch nicht ausreichend verstanden und effektiv genutzt werden. 62 % der Lehrkräfte und 69 % der IT-Verantwortlichen an Schulen sind sich einig, dass sich Investitionen mehr auf Endgeräte als auf deren didaktischen Einsatz konzentriert haben.

Viele Schulen stecken laut Epson in einer Balance-Lücke zwischen digitalen und analogen Lernmitteln. 59 % der befragten Lehrkräfte und 67 % der IT-Verantwortlichen stimmen zu, dass das Bildungswesen schneller in Technologie investiert hat, als diese pädagogisch sinnvoll integriert werden kann.

Anstatt den Einsatz von digitalen Technologien in Schulen zurückzufahren, wie von einigen Bildungssystemen beschlossen, fordern 72 % der Lehrkräfte und 85 % der IT-Verantwortlichen in Deutschland einen ausgewogeneren Einsatz. Das bedeutet, Bildschirme und klassische Materialien wie Papier und Schulbücher gleichwertig zu betrachten, individuelles und kollaboratives Lernen zu kombinieren und auf Künstliche Intelligenz sowie menschliche Urteilskraft zu setzen. Ziel sollte es sein, durchdachter in Technologie zu investieren und vom Lernerfolg her zu denken. 86 % der Lehrkräfte geben an, dass eine bessere Balance zwischen Technologie und traditionellen Lehrmethoden die Ergebnisse der Schüler:innen verbessern könnte.

Um das Ausmaß dieser Balance-Lücke zwischen digitalen und analogen Lernmitteln zu verstehen, hat Epson Lehrkräfte gebeten zu bewerten, wie gut neue technologische Lösungen eingeführt und wie ausgewogen sie im Verhältnis zu klassischen Arbeitsmitteln eingesetzt werden. Es wurden Noten auf einer Skala von 1 (überhaupt nicht ausgewogen) bis 10 (perfekt ausgewogen) vergeben:

- 5,3 von 10 Punkten für das Gleichgewicht zwischen individuellen Bildschirmen (z.B. Tablets, Laptops) und Papier (Arbeitsblätter, Schulbücher) im Unterricht, wobei 56 % angeben, dass der Einsatz von Einzelbildschirmen zu hoch ist.

- 5,3 von 10 Punkten für das Gleichgewicht zwischen einzelnen und gemeinsam genutzten Bildschirmen im Unterricht, wobei 53 % angeben, dass es zu viele individuelle Bildschirme gibt.

- 4,8 von 10 Punkten für das Gleichgewicht zwischen KI und menschlicher Urteilskraft, Aufsicht und traditionellen Lehrmethoden, wobei 65 % sagen, dass der Schwerpunkt zu sehr auf KI liegt.

Daraus ergibt sich eine Gesamtnote von 5,1 von 10 möglichen Punkten (Durchschnitt der oben genannten Werte) über alle drei Bereiche hinweg. Dies ist der Wert für Deutschland innerhalb des Educate to Empower Index.

Gleichzeitig wurden die Lehrkräfte gebeten zu bewerten (auf einer Skala von 1 bis 10), ob Schulen ihrer Meinung nach über ausreichend Technologie und Schulungsangebote verfügen, um die besten Lernergebnisse zu erzielen. Im Durchschnitt bewerteten Lehrkräfte die Schulen mit 4,9 von 10 Punkten, wobei 1 für "überhaupt nicht ausreichend" und 10 für "vollkommen ausreichend" steht. IT-Verantwortliche an Schulen vergaben eine Bewertung von 6,0 von 10 Punkten.

Dr. Sarah Henkelmann-Hillebrand, Leiterin des Bereichs Bildung bei Epson Europe, erklärt: "Um die Balance-Lücke zwischen digitalen Technologien und traditionellen Lernmitteln zu schließen, müssen wir umdenken. Bildungssysteme müssen sich davon lösen, Technologie einfach nur einzuführen, und sich stattdessen darauf konzentrieren, wie sie genutzt wird. Das bedeutet, Lernziele in den Mittelpunkt zu stellen, digitale und analoge Tools neu auszubalancieren, mehr gemeinsame und kollaborative Erfahrungen im Klassenzimmer zu schaffen und klare Rahmenbedingungen für neue Technologien wie KI zu etablieren. Es bedeutet auch, in Technologie zu investieren, die effektiven Unterricht unterstützt - und nicht nur in noch mehr Geräte. Die Zukunft der Bildung liegt nicht in mehr Technologie. Sie liegt in einer besseren Balance."

Diese Ergebnisse stammen aus der Studie "Educate to Empower 2026", die von Epson in Auftrag gegeben wurde. Den vollständigen Bericht finden Sie hier.

Über Epson

Die Epson Deutschland GmbH ist ein führender Anbieter von Druckern, Scannern und Projektoren für Unternehmen, öffentliche Auftraggeber und Privatkunden. Speziell für Handel und Industrie bietet Epson Produkte und Lösungen für den Großformat-, Kassen-, Etiketten- und Ticketdruck. Erweitert wird das Produktportfolio um Robotersysteme für Montage und Handhabung. Die Epson Deutschland GmbH wurde 1979 als Tochter der japanischen SEIKO EPSON CORPORATION gegründet. Das in Düsseldorf (Nordrhein-Westfalen) ansässige Unternehmen verantwortet die Vertriebsgebiete Deutschland, Österreich und die Schweiz.

Die Bildungstechnologielösungen von Epson unterstützen moderne, kollaborative Lernumgebungen mit zuverlässigen Druck- und Projektionslösungen für ein ausgewogenes Lehr- und Lernerlebnis. Sie ermöglichen es Lehrkräften, ansprechende Inhalte zu vermitteln, Arbeitsabläufe im Klassenzimmer zu optimieren und Betriebskosten zu senken, während gleichzeitig das Lernerlebnis der Schüler:innen durch hochwertige visuelle Medien und einfach zu bedienende Werkzeuge verbessert wird.

Mehr Informationen finden Sie hier.

Untersuchungsmethodik

Focaldata befragte im Auftrag von Epson im Juli und August 2026 nach Qualitätsprüfungen 3.360 Personen in Großbritannien, in Frankreich, Italien, Deutschland, Spanien und Polen. Die Studie umfasste vier getrennte Zielgruppenbefragungen, die unabhängig voneinander online über ein Panel durchgeführt wurden: Lehrkräfte ohne IT-Verantwortung (1.227), Schüler:innen im Alter von 16 bis 18 Jahren (1.219), angehende oder kürzlich ausgebildete Lehrkräfte (611) sowie IT-Verantwortliche und Technologie-Entscheidungsträger:innen an Schulen (303). Die Ergebnisse spiegeln die natürliche Verteilung wider; es wurde keine Gewichtung angewendet.

Pressekontakt:

Dunkelblau 360° GmbH

Bölschestraße 49

12587 Berlin

Mail: epson@dunkelblau360.com

Original-Content von: EPSON Deutschland GmbH, übermittelt durch news aktuell

Class (B2B/B2C)
B2B
Ingest Status
Rewritten
Dedupe hash
pp_6379970
Press Eligible
Yes
Press Eligible Reason
Manuelle Prüfung nötig. Risiko: MEDIUM. Flags: ['finance', 'numbers']. Stichprobe: False
Source Name
Studie
Original Summary

EPSON Deutschland GmbH: Düsseldorf (ots) - - Deutsche Schulen haben in die Einführung von digitalen Medien und Anwendungen investiert, aber sich nicht ausreichend mit dem Lernnutzen beschäftigt - 59 % der befragten Lehrkräfte und 67 % der IT-Verantwortlichen geben an, ...

Image URL
https://cache.pressmailing.net/thumbnail/highlight/bb051e38-292f-430b-a1fc-2c7530423bab/Educate%20to%20Empower_Epson.jpg?crop=4,0,630,412
Content Hash (SHA-256, erste 32 hex)
b665abfe1e6a3f93dd48bbc4e56b17e3
Vitalent: Wie ein Besetzungsversprechen das Risiko von Arbeitgebern im Gesundheitswesen absichert
Image File
Original HTML

Vitalent: Wie ein Besetzungsversprechen das Risiko von Arbeitgebern im Gesundheitswesen absichert

Hamburg (ots)

Vitalent: Personalvermittlung im Gesundheitswesen nur im Erfolgsfall

Mehrere Tausend Euro investiert, und nach drei Monaten ist die Stelle wieder frei: Diese Sorge kennen viele Inhaber und Geschäftsführer im Gesundheitswesen. Die Hamburger Matching-Plattform Vitalent begegnet ihr mit einem Modell, bei dem Kosten ausschließlich dann entstehen, wenn tatsächlich eingestellt wird. Die Vitalent Kosten sind damit vorab kalkulierbar, und das Risiko liegt beim Vermittler statt beim Arbeitgeber.

Drei Modelle, drei Risiken

Der Markt für Personalvermittlung kennt im Wesentlichen drei Abrechnungsmodelle. Beim klassischen Erfolgshonorar zahlt der Arbeitgeber bei Einstellung eine Provision, meist 20 bis 30 Prozent des Jahresbruttogehalts. Beim Retainer-Modell wird ein Teil des Honorars vorab fällig, unabhängig vom Ergebnis. Und Kampagnenmodelle verlangen Einrichtungs- oder Monatsgebühren für Anzeigen und Betreuung.

Bei Vorauszahlungen und Pauschalen trägt der Arbeitgeber das Risiko: Kommt niemand Passendes, ist das Geld weg. Beim reinen Erfolgshonorar trägt es formal der Vermittler, doch die Suche beginnt meist erst nach Vertragsschluss, und die Provision ist hoch. Vitalent folgt einer anderen Logik, weil die Suche bereits vor dem Vertrag stattgefunden hat.

Die Vitalent Kosten im Überblick

- Kostenfreies Erstgespräch: Arbeitgeber sehen konkrete Lebensläufe verfügbarer Fachkräfte aus ihrer Region, abgeglichen mit Gehaltsvorstellung, Fahrtweg und Stundenumfang, ohne jede Verpflichtung.

- Honorar nur im Erfolgsfall: In der Regel ein bis zwei Monatsgehälter der eingestellten Fachkraft, abhängig von Region, Stelle und Stundenumfang. Fällig erst bei tatsächlicher Einstellung.

- Keine Kosten ohne Einstellung: Kommt niemand zustande, zahlt der Arbeitgeber nichts.

- Kostenfreie Nachbesetzung: Scheidet eine vermittelte Fachkraft innerhalb der sechsmonatigen Probezeit aus, sucht Vitalent ohne zusätzliche Kosten nach.

Zum Vergleich: Eine klassische Provision von 20 bis 30 Prozent des Jahresbruttogehalts entspricht rund 2,4 bis 3,6 Monatsgehältern. Die Vitalent Kosten liegen damit in der Regel deutlich darunter.

So läuft das kostenfreie Erstgespräch ab

Im Erstgespräch klärt Vitalent, wen der Arbeitgeber sucht und welche Kriterien ihm wichtig sind. Auf dieser Basis wird die Datenbank gefiltert, passende Lebensläufe werden direkt präsentiert und mit den Anforderungen abgeglichen. So wird schnell klar, ob ein Match realistisch ist. Erst wenn es konkret wird, geht es um die Konditionen im Erfolgsfall. Nach der Auftragsbestätigung werden die Profile innerhalb weniger Minuten übergeben.

Das Vitalent Besetzungsversprechen

„Arbeitgeber im Gesundheitswesen haben gelernt, großen Versprechen zu misstrauen – und das zu Recht“, sagt Lars Vollrath, Gründer von Vitalent. „Wir legen deshalb die Karten offen auf den Tisch: welche Fachkräfte in der Region verfügbar sind, was wir leisten und was passiert, wenn es nicht klappt. Wer weiß, was er liefern kann, muss nichts im Kleingedruckten verstecken.“

Dass die kostenfreie Nachbesetzung selten greifen muss, liegt an der Vorarbeit. Vitalent klärt mit jeder Fachkraft vorab Gehaltsvorstellung, Fahrtweg, Arbeitszeiten und Erwartungen an den Arbeitsalltag. Die Ergebnisse geben dem Modell recht: Bei über 600 Gesundheitsunternehmen hat Vitalent mehr als 1.000 Stellen besetzt. 93 Prozent der Projekte schließen die ersten zwölf Wochen mit einer Besetzung ab, die über die sechsmonatige Probezeit hinaus Bestand hat.

Schnelle Besetzung, geringer Aufwand

Nach rund zwei Wochen finden in der Regel die ersten Vorstellungsgespräche statt, nach etwa sechs Wochen ist die Stelle besetzt. Weitergeleitet werden ausschließlich Kandidaten, die ein Gespräch ausdrücklich wünschen. Für Arbeitgeber heißt das: keine Anzeigenschaltung, kein Sichten von Bewerbungsstapeln, keine Telefonate mit Unpassenden. Der Aufwand bis zum ersten Vorstellungsgespräch liegt für Neukunden bei rund einer Stunde.

Was eine unbesetzte Stelle kostet – ein Rechenbeispiel

Fehlt in einer Zahnarztpraxis eine Zahnmedizinische Fachangestellte (ZFA), kann ein Behandlungsstuhl nicht voll genutzt werden. Angenommen, dadurch fallen zwei Behandlungsstunden pro Tag weg und die Praxis erwirtschaftet rund 250 Euro je Behandlungsstunde: Dann fehlen nach 20 Arbeitstagen etwa 10.000 Euro Umsatz, Monat für Monat. Dem steht bei einem ZFA-Bruttogehalt von rund 3.000 Euro ein einmaliges Honorar von etwa 3.000 bis 6.000 Euro gegenüber. In diesem Beispiel hat sich die Vermittlung bereits im ersten Monat nach der Einstellung gerechnet. In der Pflege sieht die Rechnung ähnlich aus: Touren müssen umverteilt, Überstunden bezahlt und im schlimmsten Fall neue Patienten abgelehnt werden.

Fazit: Kalkulierbare Vitalent Kosten statt Vorkasse ins Ungewisse

Das Vitalent Besetzungsversprechen verbindet Transparenz vor der Entscheidung, Kosten nur im Erfolgsfall und Sicherheit während der Probezeit. Für Praxen, Pflegedienste und Kliniken wird Recruiting damit zu einer Rechnung, die sich vorher aufstellen lässt, ohne ins Ungewisse zu zahlen.

Häufige Fragen

Was kostet Vitalent? Das Erstgespräch mit Überblick über verfügbare Fachkräfte ist kostenfrei. Ein Honorar fällt erst bei einer Einstellung an, als Faustregel ein bis zwei Monatsgehälter der eingestellten Fachkraft.

Welche Vitalent Kosten entstehen, wenn niemand eingestellt wird? Keine. Ohne Einstellung fällt kein Honorar an.

Wie lange gilt die kostenfreie Nachbesetzung? Für die gesamte Probezeit von sechs Monaten.

Wie viel Aufwand hat der Arbeitgeber? Für Neukunden rund eine Stunde bis zum ersten Vorstellungsgespräch. Ansprache, Vorqualifizierung und Terminvorbereitung übernimmt Vitalent.

Über Vitalent

Vitalent ist eine Matching-Plattform für Personalvermittlung im Gesundheitswesen mit Sitz in Hamburg, gegründet von Lars Vollrath und Ben Burmester. Die Plattform verbindet Pflegefachkräfte, MFA, ZFA, Therapeuten und weitere Gesundheitsberufe mit Praxen, Pflegediensten, Pflegeheimen und Kliniken in ganz Deutschland. Fachkräfte registrieren sich kostenlos und anonym, Arbeitgeber zahlen ausschließlich im Erfolgsfall. Weitere Informationen unter vitalent.io.

Pressekontakt:

Vitalent

Neumühlen 15, 22763 Hamburg

Email: presse@vitalent.io

Original-Content von: Vitalent, übermittelt durch news aktuell

Class (B2B/B2C)
B2B
Ingest Status
Need Review
Dedupe hash
pp_40000235
Press Eligible
Yes
Press Eligible Reason
QA FAIL (need review): The final paragraph is generic 'About [Company]' boilerplate (Vitalent's platform description) that adds no news context and is directly taken from the source's 'Über Vitalent' section. Replace it with a news-relevant ending or remove it.
Source Name
Vitalent
Original Summary

Vitalent: Vitalent: Personalvermittlung im Gesundheitswesen nur im Erfolgsfall Mehrere Tausend Euro investiert, und nach drei Monaten ist die Stelle wieder frei: Diese Sorge kennen viele Inhaber und Geschäftsführer im Gesundheitswesen. Die Hamburger ...

Image URL
https://cache.go.newsaktuell.de/images/6e46c487-950d-438c-8a64-67f2318258ae/highlight/1793200094492-Selbstbewusster-Geschaftsmann-im-modernen-Buro.jpeg
Generated Article_json
{"target_audience": "b2b", "is_medical": false, "ai_generated_title": "Vitalent Charges Healthcare Employers Only on Successful Hires", "body_html": "<p><strong>Hamburg -- [CURRENT_DATE] --</strong> Hamburg-based matching platform Vitalent bills healthcare employers one to two monthly salaries per hire, and only once a hire is made, against the 2.4 to 3.6 monthly salaries implied by classic agency commissions.</p><h5>Vitalent shifts recruiting risk from employers to the intermediary</h5><p>Placement fees in healthcare recruiting follow three models, according to Vitalent. Classic success fees typically run 20% to 30% of annual gross salary. Retainer models make part of the fee due upfront regardless of outcome. Campaign models charge setup or monthly fees for advertising and support.</p><p>Vitalent says upfront payments and flat fees leave the employer holding the risk if no suitable candidate emerges. In its view, pure success fees only formally shift risk to the agency, because the search usually starts after contract signing and the commission is high. Vitalent runs the search before any contract exists.</p><h5>Fee applies only on hire, with free replacement during six-month probation</h5><p>The first consultation is free. Employers see concrete CVs of available professionals in their region, matched against salary expectations, commuting distance and working hours. The fee falls due only on actual hire. If a placed professional leaves within the six-month probation period, Vitalent restarts the search at no extra cost.</p><p>Founder Lars Vollrath says healthcare employers have learned to distrust big promises, and that Vitalent therefore discloses which professionals are available, what it delivers and what happens if a placement fails.</p><h5>Vitalent reports 1,000 filled positions and a 93% retention rate</h5><p>Vitalent has filled more than 1,000 positions at over 600 healthcare companies. According to the company, 93% of projects close the first twelve weeks with a placement that lasts beyond the six-month probation period.</p><p>First interviews typically take place after about two weeks, and positions are filled after roughly six weeks. Only candidates who explicitly request an interview are forwarded. New clients spend about one hour on the process before the first interview. Profiles are handed over within minutes of order confirmation.</p><h5>Dental practice example puts monthly revenue loss at 10,000 euros</h5><p>Vitalent's worked example assumes a dental practice missing a dental assistant. Two lost treatment hours per day at about 250 euros per hour add up to roughly 10,000 euros in missing revenue after 20 working days, every month the post stays vacant.</p><p>Against a gross salary of about 3,000 euros, the one-time fee comes to roughly 3,000 to 6,000 euros. In this scenario, the placement pays for itself within the first month after hiring. Vitalent says the calculation is similar in nursing care, where routes must be redistributed, overtime paid and, in the worst case, new patients turned away.</p><p>The platform, founded by Vollrath and Ben Burmester, serves nursing professionals, medical and dental assistants, therapists and other healthcare roles at practices, care services, nursing homes and clinics across Germany.</p>", "meta_description": "Hamburg platform Vitalent charges healthcare employers one to two monthly salaries only on hire, with free replacement during the six-month probation period.", "seo_keywords": "Vitalent, healthcare recruiting, success-based fee, staffing Germany, placement guarantee, nursing recruitment, dental assistant, probation replacement", "companies": ["Vitalent"], "industries": ["Staffing And Recruiting"], "markets_regions": ["Germany"], "news_type": ["pricing_model", "company_announcement"], "products": [], "themes": ["recruitment_cost_risk", "healthcare_staffing"], "events": [], "cta_text": "Learn more about Vitalent's success-based healthcare recruiting model", "learn_more": "", "fact_check": {"accuracy_score": 100, "legal_risk": "low", "corrections_made": ["Paraphrased the German founder quote per editorial rules", "Attributed the 93% retention and 1,000-placement figures to Vitalent as company-reported", "Replaced the source date with the [CURRENT_DATE] placeholder"], "recommendation": "publish"}}
Content Hash (SHA-256, erste 32 hex)
43848b46ce8052ac49e5d73993a69756
Vitalent Erfahrungen: Was Arbeitgeber aus Praxis, Pflege und Klinik über die Hamburger Matching-Plattform berichten
Image File
Original HTML

Vitalent Erfahrungen: Was Arbeitgeber aus Praxis, Pflege und Klinik über die Hamburger Matching-Plattform berichten

Hamburg (ots)

Vitalent: Hamburger Matching-Plattform besetzt Stellen im Gesundheitswesen schneller und risikoärmer

Bis 2035 könnten im deutschen Gesundheitswesen laut einer Prognose von PwC rund 1,8 Millionen Stellen unbesetzt bleiben. Praxen, Pflegedienste und Kliniken spüren das täglich: Stellenanzeigen ohne Rückmeldung, Vermittler ohne Ergebnis. Die Vitalent Erfahrungen von Arbeitgebern zeigen einen anderen Weg: vorgeprüfte Kandidaten, kurze Besetzungszeiten und ein Honorar, das nur bei einer Einstellung anfällt.

Vitalent Erfahrungen auf einen Blick

- Über 1.000 besetzte Stellen bei mehr als 600 Gesundheitsunternehmen

- 93 Prozent der Projekte führen in den ersten zwölf Wochen zu einer Besetzung, die über die sechsmonatige Probezeit hinaus Bestand hat

- Erste Profile direkt nach Projektstart, erste Vorstellungsgespräche nach rund zwei Wochen, Besetzung nach etwa sechs Wochen

- Rund eine Stunde Aufwand für Neukunden bis zum ersten Vorstellungsgespräch

- Kein Honorar ohne Einstellung, kostenfreie Nachbesetzung in der Probezeit

Warum Arbeitgeber skeptisch sind – und was Vitalent anders macht

In Branchenforen kehrt ein Satz immer wieder: Man zahle mehrere Tausend Euro, und die neue Kraft kündige in der Probezeit. Viele Inhaber und Geschäftsführer haben Agenturen erlebt, die viel versprachen und bei Details vage blieben. Wer heute einen Vermittler sucht, vergleicht deshalb Erfahrungen statt Versprechen.

Vitalent dreht den Ablauf um. Arbeitgeber sehen bereits im kostenfreien Erstgespräch passende Lebensläufe aus ihrer Region, noch bevor sie einen Vertrag schließen. Niemand zahlt vorab und hofft dann auf Bewerbungen.

So funktioniert Vitalent

Auf der Hamburger Plattform registrieren sich Pflegefachkräfte, Medizinische Fachangestellte (MFA), Zahnmedizinische Fachangestellte (ZFA) und Therapeuten kostenlos und anonym. Nicht die Fachkraft bewirbt sich beim Arbeitgeber, Vitalent stellt der Fachkraft passende Arbeitgeber vor.

Vor jeder Übergabe klären spezialisierte Recruiter am Telefon Qualifikation, Deutschkenntnisse, Wohnort, Gehaltsvorstellung und Erwartungen und prüfen die Unterlagen auf Echtheit. Beim Arbeitgeber landen nur Kandidaten, die ausdrücklich ein Gespräch wünschen. Er ruft an, vereinbart einen Termin, lässt bei Bedarf hospitieren und stellt ein.

Vitalent Erfahrungen aus der Praxis

- Ambulanter Pflegedienst, Niedersachsen: Nach mehreren Agenturen und Social-Media-Kampagnen war die Befürchtung groß, in der ländlichen Region gebe es niemanden Passenden mehr. Mit Vitalent wurden innerhalb von sieben Wochen eine Pflegedienstleitung und eine Pflegefachkraft eingestellt.

- Kardiologische Praxis, Augsburg: Bisherige Vermittler hatten Bewerber vorgestellt, deren Deutsch- oder Fachkenntnisse nicht passten. Bei Vitalent lagen schon im Erstgespräch passendere Profile vor, nach drei Wochen war die MFA-Stelle besetzt.

- Zahnarztpraxis, Leipheim: zwei ZFA in sechs Wochen eingestellt.

- Physiotherapiepraxis, Kaiserslautern: ein Physiotherapeut nach sechs Wochen eingestellt.

- Stationäre Pflegekette, Norddeutschland: 18 Standorte in fünf Bundesländern, seit Jahren Kunde, Suchen für alle Häuser und bereits hunderte Bewerber. Einmal angelegte Suchmandate lassen sich jederzeit reaktivieren.

Das Risiko liegt nicht beim Arbeitgeber

„Im Gesundheitswesen haben Arbeitgeber zu oft schlechte Erfahrungen mit Personalvermittlern gemacht – sie haben gezahlt und nichts bekommen“, sagt Lars Vollrath, Gründer von Vitalent. „Deshalb haben wir das Modell so gebaut, dass unser Honorar nur dann anfällt, wenn auch tatsächlich jemand eingestellt wird. Das Risiko soll nicht beim Arbeitgeber liegen, sondern bei uns.“

Das Vitalent Besetzungsversprechen ist schriftlich festgehalten. Kommt keine Einstellung zustande, entstehen keine Kosten. Im Erfolgsfall liegt das Honorar als Faustregel bei ein bis zwei Monatsgehältern, abhängig von Region, Stelle und Stundenumfang. Scheidet eine vermittelte Fachkraft innerhalb der sechsmonatigen Probezeit aus, sucht Vitalent kostenfrei nach.

Wenig Aufwand, Betreuung nach Bedarf

Ein Punkt taucht in den Vitalent Erfahrungen immer wieder auf: wie wenig Kunden selbst tun müssen. Neukunden investieren rund eine Stunde, vor allem für Anforderungen und Stellenvorstellung. Danach ist das Team bei Bedarf erreichbar, verordnet aber keine Pflichttermine. „Unsere Kunden haben volle Wartezimmer, Dienstpläne und Touren im Kopf“, sagt Vollrath. „Niemand braucht einen Call, nur damit einer stattgefunden hat.“

Fazit: Was die Vitalent Erfahrungen zeigen

Die Erfahrungen von Kunden aus Praxis, Pflege und Klinik ähneln sich in drei Punkten: Die Stelle ist in der Regel nach etwa sechs Wochen besetzt, der Aufwand bleibt gering, und das Risiko trägt Vitalent. Ob Pflegedienst auf dem Land, Zahnarztpraxis in der Kleinstadt oder Träger mit 18 Standorten: Arbeitgeber müssen keinen Vertrauensvorschuss geben, sondern sehen vor der Entscheidung, welche Fachkräfte verfügbar sind.

Häufige Fragen

Welche Erfahrungen haben Arbeitgeber mit Vitalent gemacht? Kunden berichten vor allem von vorgeprüften Profilen, kurzen Besetzungszeiten und geringem Aufwand. Bei über 600 Gesundheitsunternehmen wurden bereits mehr als 1.000 Stellen besetzt.

Wie schnell besetzt Vitalent eine Stelle? In der Regel nach etwa sechs Wochen. Erste Profile gibt es direkt nach Projektstart, erste Gespräche nach rund zwei Wochen.

Was kostet Vitalent? Ein Honorar fällt nur bei einer Einstellung an, als Faustregel ein bis zwei Monatsgehälter. Ohne Einstellung entstehen keine Kosten.

Was passiert, wenn eine Fachkraft in der Probezeit kündigt? Vitalent sucht innerhalb der sechsmonatigen Probezeit kostenfrei nach.

Für welche Berufe eignet sich Vitalent? Für Pflegefachkräfte, MFA, ZFA, Therapeuten und weitere Gesundheitsberufe in Praxen, Pflegediensten, Pflegeheimen und Kliniken.

Über Vitalent

Vitalent ist eine Matching-Plattform für Personalvermittlung im Gesundheitswesen mit Sitz in Hamburg, gegründet von Lars Vollrath und Ben Burmester. Die Plattform verbindet Pflegefachkräfte, MFA, ZFA, Therapeuten und weitere Gesundheitsberufe mit Praxen, Pflegediensten, Pflegeheimen und Kliniken in ganz Deutschland. Fachkräfte registrieren sich kostenlos und anonym, Arbeitgeber zahlen ausschließlich im Erfolgsfall. Weitere Informationen unter www.vitalent.io.

Pressekontakt:

Vitalent

Neumühlen 15, 22763 Hamburg

Email: presse@vitalent.io

Original-Content von: Vitalent, übermittelt durch news aktuell

Class (B2B/B2C)
B2B
Ingest Status
Rewritten
Dedupe hash
pp_40000236
Press Eligible
Yes
Press Eligible Reason
Manuelle Prüfung nötig. Risiko: MEDIUM. Flags: ['finance', 'numbers']. Stichprobe: False
Source Name
Vitalent Erfahrungen
Original Summary

Vitalent: Vitalent: Hamburger Matching-Plattform besetzt Stellen im Gesundheitswesen schneller und risikoärmer Bis 2035 könnten im deutschen Gesundheitswesen laut einer Prognose von PwC rund 1,8 Millionen Stellen unbesetzt bleiben. Praxen, Pflegedienste ...

Image URL
https://cache.go.newsaktuell.de/images/a4ff5e50-249c-48ce-aff1-7859e4c25601/highlight/1793198823760-Zwei-Geschaftsleute-im-modernen-Buro.jpg
Content Hash (SHA-256, erste 32 hex)
03ca778a997ebcc8ea67cec480f68e4c