Why Is Your OPC UA Connection Working but No Data Reaching the Historian?
Image File
Original HTML

A successful OPC UA connection check proves only part of the path. It shows that the client can reach the endpoint and pass the connection test. It does not prove that the intended nodes are readable, monitored, mapped, or written to the historian.

Troubleshoot in that order. Begin with one known, changing point and follow it from the OPC UA server to one expected historian table. Large tag lists hide the first failure.

1. Prove the source value is readable and changing

Use an independent OPC UA client with the same endpoint and user identity as the collector. Browse to one expected variable, read its Value attribute, and watch it long enough to see a real change.

Record four fields from the returned DataValue: value, status code, source timestamp, and server timestamp. A Bad result is not a usable measurement. An Uncertain result needs an explicit quality policy.

If the value never changes in the test client, the historian path is not yet the problem. Confirm that you selected a live process variable rather than a configuration property, stale simulation point, or object node. Check the upstream PLC or device scan as well. An OPC UA server cannot report a change it never receives.

If the test client can read the point but the collector cannot, keep the same point and move to identity, node selection, and monitoring checks.

2. Verify the exact node and user rights

An active session does not mean the user can read every variable. OPC UA Read operations can return Bad_NodeIdUnknown, Bad_NotReadable, Bad_UserAccessDenied, or Bad_SecurityModeInsufficient. Review item-level results and collector logs rather than relying on the session state.

Copy the canonical NodeId from the server browser. A NodeId includes its namespace and identifier, such as ns=2;s=Channel1.Device1.Tag1. Namespace indexes point into the server’s NamespaceArray and can change between sessions. Robust integrations should resolve the intended namespace URI instead of assuming an old numeric index always identifies the same namespace.

Also review the collector’s root node, namespace selection, node-class filter, and point-name or point-ID regular expressions. A filter can return zero variables while the endpoint remains perfectly reachable. Preview the matched point set when the connector offers that option.

Finally, test with the collector’s actual identity. An administrator account in a desktop test client does not validate the service account used in production. Confirm browse, read, and monitoring rights for the selected nodes. If secure-channel trust and user authentication are configured separately, verify both.

3. Determine whether collection is idle or broken

For polling, compare the configured interval and timeout with the time required to read the selected point set. If a cycle takes longer than expected or repeatedly times out, reduce the test to one point. Then increase the scope in measured batches.

For subscription, check that monitored items were created successfully and are in Reporting mode. Inspect the server’s revised sampling interval, queue size, and filter result. A live session can coexist with an expired or misconfigured subscription.

No notification does not always mean failure. A change-based subscription may remain quiet when the value is stable or when a deadband filters small changes. Force a safe, known change or temporarily monitor a point that changes regularly. If a direct read works but the subscription does not, focus on monitored-item status, filters, publishing, queues, and permissions.

Watch for overflow. When a monitored-item queue fills, OPC UA can discard values according to its queue policy and set the overflow information bit. This matters when the source changes faster than the collector can drain notifications.

4. Trace timestamps, types, and mapping

Once the collector receives a valid value, inspect its raw or pre-write representation. Then answer these questions:

- Which timestamp becomes the historian timestamp: source, server, request, or receipt time?

- Is that timestamp plausible in UTC, or is clock drift placing rows outside the query window?

- Does the source value type map to the target column type without conversion errors?

- Which target database, table, and value column should receive the point?

- Is a filter, transform, or naming rule rejecting the record?

A timestamp error often looks like missing data. The row may exist hours in the future, far in the past, or outside a dashboard’s default time range. Query a wide time range and inspect maximum and minimum timestamps before concluding that no rows were written.

Mapping problems can be quiet. A point may be directed to an unexpected child table because its NodeId was transformed into a table name. Verify the destination produced by the active rule rather than the table name expected from a display name.

5. Separate source health from historian write health

Check counters or logs at both sides of the collector pipeline. You need evidence of records read and records written. If the read count increases but the write count does not, the fault is downstream of OPC UA. Look for schema mismatch, rejected rows, target authentication, unavailable storage, or batch errors.

If neither count increases, return to point selection and collection mode. If both counts increase but a dashboard is empty, query the target table directly and inspect its time range, database, and table name. Do not use a visualization as the first proof of ingestion.

For an interruption test, change one safe point at a recorded time and follow that single event through the source client, collector log or metric, historian query, and dashboard. This creates a precise boundary between each stage.

Applying the workflow to TDengine

For teams using an industrial time-series database as the historian destination, the source connection and the database write path still need separate checks. In TDengine TSDB-Enterprise, the OPC UA connector documentation identifies the connector as an Enterprise feature; TDengine TSDB-OSS does not include it.

An OPC UA task can show Running while its recent health gives more useful detail. Idle means no data entered the pipeline during the health-check period. Pending means the source is healthy but the writer has no messages. SourceError points to reading or reconnecting problems, while SinkError points to the target write side. Bounce indicates that write errors crossed the configured threshold.

For a no-data case, first preview the selected points and confirm the task’s database, supertable expression, subtable expression, value column, and timestamp choice. TDengine’s current connector supports origin_ts, request_ts, and received_ts. Its CSV mapping requires a unique point_id and a target supertable and subtable for every row.

Next, compare modes with one point. subscribe writes reported changes. observe polls the latest value at the task’s collection interval, which defaults to 10 seconds. If observe writes rows but subscribe remains silent during a confirmed change, the evidence points back toward subscription creation, reporting, or filtering rather than endpoint connectivity or the TDengine write path.

When the connector receives data faster than TDengine can accept it, TDengine documents an optional Cache Realtime Data setting that persists OPC UA messages to local files for later draining. It is disabled by default. Enable it only with an operating plan for disk location, capacity, monitoring, and recovery testing.
Class (B2B/B2C)
B2B
Ingest Status
Rewritten
Dedupe hash
4126a665f4ad81870b525b6d1cf57054
Press Eligible
Yes
Press Eligible Reason
Manuelle Prüfung nötig. Risiko: MEDIUM. Flags: ['numbers']. Stichprobe: False
Source Name
TDengine
Original Summary

A successful OPC UA connection check proves only part of the path. It shows that the client can reach the endpoint and pass the connection test. It does not prove that the intended nodes are readable, monitored, mapped, or written to the historian. Troubleshoot in that order. Begin with one known, changing point and follow ... <a class="read-more" href="https://tdengine.com/opc-ua-connected-but-no-historian-data/&quot; title="Why Is Your OPC UA Connection Working but No Data Reaching the Historian?">Read more</a>

Image URL
https://eujqw4hwudm.exactdn.com/wp-content/uploads/nh-0326-02.png
Source Node
Content Hash (SHA-256, erste 32 hex)
99aa9c902d8b5c9eeb975cdbdb766f18
OPC UA Polling vs. Subscription: Which Should You Use for Industrial Data Collection?
Image File
Original HTML

An OPC UA client can collect process values in two common ways. It can read each value on a schedule, usually called polling, or it can create monitored items and receive notifications through a subscription. Both methods are valid. The right choice depends on what the historian must preserve, how often values change, and what the OPC UA server can sustain.

For most continuously monitored process variables, start with a data-change subscription. Choose polling when the required record is explicitly periodic, the server has weak subscription support, or a regular snapshot matters more than capturing every change. Native OPC UA alarms and events are a separate case, covered below.

What polling does

In a polling design, the collector issues Read requests at a configured interval. A ten-second poll asks for the latest value every ten seconds, even if that value has not changed since the previous request.

This produces a predictable schedule at the client. It does not prove that the source changed at the same cadence. Each read returns a DataValue that can include a value, quality status, and timestamps. The historian still needs a clear rule for which timestamp and quality states it accepts.

Polling works well for periodic reporting, slow-changing values that still need regular records, and servers with limited subscription support. The cost is repeated read traffic whether values changed or not.

Polling can also miss transitions between reads. If a motor status changes from 0 to 1 and back to 0 inside a ten-second interval, both surrounding polls may return 0. A shorter interval reduces that risk but increases load. It never removes the basic blind spot between samples.

What a subscription does

An OPC UA subscription groups monitored items and returns notifications to the client. Each monitored item has a requested sampling interval, optional filter, and queue. The subscription has a publishing interval that controls how often it attempts to return pending notifications.

Sampling and publishing are different. The server may sample a value several times within one publishing interval. It can also revise requested intervals or queue sizes, so the client should inspect the settings the server accepted.

Data-change subscriptions usually send fewer unchanged values. A DataChangeFilter can control when a new sample generates a notification, including the use of a deadband where supported. This makes them a good fit for sparse or irregular changes and for ordinary variables where intermediate transitions matter.

Subscriptions are not a promise of unlimited delivery. If a monitored-item queue fills, values can be discarded according to its queue policy, and OPC UA marks the overflow in the status information. The client must also maintain the subscription lifetime.

The practical tradeoffs

Neither mode automatically creates a complete history. Polling needs an interval short enough for the process. Subscription needs suitable sampling, filtering, queue capacity, and recovery. A fast client setting cannot create source resolution that the server does not have.

Three common collection decisions

Suppose a quality report requires one temperature record every minute, including periods when the temperature is unchanged. Polling fits that requirement because the record is explicitly periodic. Check that the source timestamp and device scan rate still support the meaning of a one-minute sample.

For a motor running status, a data-change subscription is usually a better fit. It avoids storing repeated copies of the same state and can capture transitions between polling cycles, provided the server sampling rate and monitored-item queue are adequate.

Native OPC UA alarms and events require event monitoring. They use event notifier nodes and an EventFilter, not the DataChangeFilter used for ordinary variable values. If the historian must retain alarm identity, severity, acknowledgement, and state transitions, collect the native event stream rather than inferring an alarm lifecycle from a Boolean tag alone.

A mixed design is often more accurate than one global rule. Poll periodic records, subscribe to changing process values, and use OPC UA Alarms & Events for native event semantics.

Settings to validate before deployment

- Define the loss you can tolerate. Write down the shortest event that must be captured and the longest acceptable delay before it reaches the historian.

- Check the server’s revised subscription values. Confirm actual sampling interval, publishing interval, queue size, and filter result.

- Preserve quality and the right timestamp. Do not treat a bad OPC UA status as a usable measurement, and decide whether source, server, request, or receipt time fits the application.

- Test overload and interruption. Drive representative point counts and change rates, interrupt the network, and check for overflow, gaps, duplicates, and recovery behavior.

- Measure the full path. Compare source changes with collector input and historian rows. A healthy OPC UA session does not prove that every selected value was stored.

How this maps to TDengine

When collected process values need to be retained and queried in an industrial time-series database, TDengine TSDB-Enterprise provides OPC UA ingestion through taosExplorer and taosX. The current OPC UA connector documentation labels this an Enterprise feature and states that TDengine TSDB-OSS does not include it. An agent is optional when taosX can reach the OPC UA server directly; otherwise, taosX-Agent can run on a host with access to the server.

TDengine documents three OPC UA collection modes: subscribe for data-change reports from ordinary points, observe for scheduled reads, and event for native alarms and events. The event mode uses an event-specific monitored-item and filter path; it is not the same as subscribing to value changes. In observe mode, the default collection interval is 10 seconds, and all ordinary points in one task share that interval. Points that require different poll periods should be separated into different tasks.

TDengine also lets a point use the OPC origin timestamp, request timestamp, or received timestamp as the TDengine timestamp. Make that choice from the engineering requirement, not convenience. For example, received time can help order ingestion consistently, while origin time better preserves when the source said the measurement occurred. Review source clock quality before relying on origin time.

Start with subscribe for normal change-based process collection. Switch a test task to observe when you need a periodic record or want to isolate a subscription problem. Use event when the source and requirement involve native OPC UA alarms or events. Treat each choice as an engineering decision, not a universal performance rule.

Class (B2B/B2C)
B2B
Ingest Status
Rewritten
Dedupe hash
5d2107e3caab4f81b0f49919919e560d
Press Eligible
Yes
Press Eligible Reason
Manuelle Prüfung nötig. Risiko: MEDIUM. Flags: ['none']. Stichprobe: False
Source Name
TDengine
Original Summary

An OPC UA client can collect process values in two common ways. It can read each value on a schedule, usually called polling, or it can create monitored items and receive notifications through a subscription. Both methods are valid. The right choice depends on what the historian must preserve, how often values change, and what ... <a class="read-more" href="https://tdengine.com/opc-ua-polling-vs-subscription/&quot; title="OPC UA Polling vs. Subscription: Which Should You Use for Industrial Data Collection?">Read more</a>

Image URL
https://eujqw4hwudm.exactdn.com/wp-content/uploads/nh-0326-02.png
Source Node
Content Hash (SHA-256, erste 32 hex)
01e4ccaea3f9d83e5eb919fc65720be5
OPC UA Timestamps: Which Time Should Your Historian Actually Store?
Image File
Original HTML

OPC UA can attach more than one time to the same value. Those timestamps answer different questions. Choosing one without defining its meaning can reorder events, hide network delay, or place valid data outside the historian query window.

For most process analysis, use a trustworthy SourceTimestamp as the event time. Preserve a collector receipt timestamp as a separate field when the ingestion path supports it. Use server, request, or receipt time as the primary historian time only when that better matches the application or the source clock cannot be trusted.

SourceTimestamp means time at the source

The OPC UA SourceTimestamp represents the time applied to a value by its data source. The specification says it should describe the last change of the value or status and should be generated as close to the source as possible. Once assigned to that value instance, it does not change as the value passes through another OPC UA server.

This timestamp is usually the best fit for sequence-of-events work, batch analysis, and calculations that depend on when the process changed. It keeps the event on the process timeline even if the message reaches the historian late.

SourceTimestamp is not automatically accurate. A PLC, gateway, or source server may have a drifting clock, a wrong time setting, or poor synchronization with other sites. The timestamp may also be null when the source cannot provide it. Before treating source time as authoritative, compare it with a trusted clock and monitor the offset over time.

ServerTimestamp means time known by the OPC UA server

The ServerTimestamp reflects when the OPC UA server received a value or knew it to be accurate. If one OPC UA server receives values from another, each server applies its own ServerTimestamp while preserving the original SourceTimestamp.

Server time can help diagnose the segment between the source and the server. It may also be useful when the source clock is unavailable but the server clock is controlled. It is not a substitute for source time when the question is exactly when the physical process changed.

The two clocks may not be synchronized. A large difference can mean device clock drift, upstream buffering, an incorrect clock, or real transport delay. Treat the difference as a diagnostic signal, not automatically as latency.

Collection time adds another clock

Many collectors also record when they requested or received a value. These are collector timestamps, not OPC UA DataValue timestamps defined by the standard.

Receipt time answers, “When did this collector see the record?” It supports latency and backlog monitoring. Request time can identify the scheduled collection cycle that produced an observation.

Neither time proves when the process changed. If an outage delays a source event by 20 minutes, stamping it only with receipt time makes the late event look new. This can distort trends and calculations even though the database write itself is successful.

Choose the primary time from the use case

If the system can store more than one timestamp, keep source time and receipt time. One supports process meaning; the other supports delivery diagnostics. Server time can add value when the source-to-server segment needs separate analysis.

Names such as source_ts, server_ts, and received_ts make the semantics visible to query authors. Document which field is primary and what happens when it is null or implausible.

Plan for late and out-of-order data

Store-and-forward recovery and server-side history can deliver old source events after newer ones. A historian that uses SourceTimestamp should accept that such records are late or out of arrival order.

This is expected behavior, not necessarily corrupt data. Queries should order by event time. Streaming calculations and windowed aggregates need a policy for late arrivals, such as recalculating prior windows or flagging records for reconciliation.

Also define duplicate handling because reconnect or backfill can resend a record. Point identity, event time, value, quality, and an available event identifier can help distinguish duplicates from legitimate observations.

For more on recovering and validating historical data after network interruptions, see our guide to preventing OPC UA data gaps.

Keep UTC in storage and localize at display time

OPC UA conveys time values in UTC, while the client handles conversion to local time. Keep UTC through collection and historian storage. Convert it only in dashboards, reports, or user interfaces.

Adding a fixed offset before storage creates trouble at daylight-saving transitions and when data spans sites in different zones. It can also hide a clock configuration error. Store the site time zone as metadata if operators need local views, but do not rewrite the event itself as an ambiguous local timestamp.

UTC describes the time scale, not the accuracy of each clock. Monitor clock status and source-to-receipt offset. Flag implausible timestamps rather than silently replacing them.

Mapping OPC UA time in TDengine

The current TDengine TSDB-Enterprise OPC UA connector documentation offers three timestamp choices for a point: origin_ts, request_ts, and received_ts. The selected value becomes the TDengine timestamp column. In CSV mapping, the corresponding columns are the source timestamp, the time taosX issued the request, and the time taosX received the value.

TDengine’s origin_ts is the connector’s original OPC point timestamp. The documentation does not describe request_ts or received_ts as OPC UA ServerTimestamp fields. Keep that product mapping separate from the OPC UA standard’s SourceTimestamp and ServerTimestamp terminology.

For process history in a time-series database, start with origin_ts only after confirming that the source clock is sound. Choose received_ts when ingestion chronology is the intended time axis or when source timestamps are unusable. For polled observations, request_ts may align the row with the collection cycle.

Where the mapping format allows multiple timestamp columns, retain an additional request or receipt timestamp for troubleshooting. Confirm which configured field becomes the primary timestamp, then test late records, equal timestamps, null source times, and clock drift with representative points before rollout.

A five-question timestamp review

- Which system owns each timestamp, and is its clock synchronized?

- Does the application need process time, observation time, or arrival time?

- What happens when source time is null, stale, or implausible?

- Can the historian and downstream calculations handle late records?

- Can an engineer compare source and receipt time during an outage investigation?

The answer should be part of the historian data contract. Timestamp choice is not a connector default to accept blindly. It determines what every trend, aggregate, and event sequence will mean.

Class (B2B/B2C)
B2B
Ingest Status
Rewritten
Dedupe hash
044413805ef9eddb09e94018b4fd3fa2
Press Eligible
Yes
Press Eligible Reason
Manuelle Prüfung nötig. Risiko: MEDIUM. Flags: ['numbers']. Stichprobe: True
Source Name
TDengine
Original Summary

OPC UA can attach more than one time to the same value. Those timestamps answer different questions. Choosing one without defining its meaning can reorder events, hide network delay, or place valid data outside the historian query window. For most process analysis, use a trustworthy SourceTimestamp as the event time. Preserve a collector receipt timestamp ... <a class="read-more" href="https://tdengine.com/opc-ua-timestamps-historian/&quot; title="OPC UA Timestamps: Which Time Should Your Historian Actually Store?">Read more</a>

Image URL
https://eujqw4hwudm.exactdn.com/wp-content/uploads/nh-0326-02.png
Source Node
Content Hash (SHA-256, erste 32 hex)
4fff461e64db53818a14bcf4c0b17ed9
How to Prevent Data Gaps in OPC UA Collection During Network Outages
Image File
Original HTML

An OPC UA connection can recover after an outage while the historian still has a hole. Reconnection restores communication. It does not prove that every value generated during the interruption survived.

Preventing OPC UA data gaps starts with identifying which link failed. A typical path has three responsibilities: the source creates or exposes measurements, the collector receives them, and the historian stores them. Buffering at one layer cannot repair a loss that occurred earlier in the path.

Locate the interruption before choosing a recovery method

Consider a common architecture:

Device or PLC -> OPC UA server -> collector -> historian

If the device or OPC UA server stops producing values, the collector has nothing to recover unless the source keeps its own history. If the link between the OPC UA server and collector fails, recovery depends on server-side subscription queues, the subscription lifetime, client reconnect behavior, and any historical-access capability. If the collector continues reading but cannot reach the historian, a durable local buffer at the collector can protect those already collected messages.

These are different failures. Calling all of them a network outage leads to the wrong fix.

Subscription queues cover short interruptions, not unlimited history

An OPC UA subscription can bridge a temporary communication break. Monitored items queue notifications, messages carry sequence numbers, and a client can request retransmission after reconnecting. This only works while the subscription remains alive and the necessary notifications remain in the server’s queues.

Queue depth matters. If a point changes faster than its monitored-item queue can hold, old or new values are discarded according to the queue policy. The overflow status tells a capable client that loss occurred. The subscription lifetime also matters because the server deletes the subscription and its monitored items when that lifetime expires.

Normal subscription queues are generally kept in memory. A server restart can remove them. OPC UA also defines durable subscriptions for longer interruptions and server restarts, but server and client support must be confirmed. Durable subscriptions are an optional capability, not something a historian engineer should assume is active.

Set the queue and lifetime from the fastest credible change rate and the longest interruption the design is expected to tolerate. Then check the revised values accepted by the server. Requested values are not proof of actual capacity.

Store and forward protects a different part of the path

Store and forward usually means that a collector writes accepted messages to local persistent storage before sending them upstream. If the historian or wide-area link is unavailable, collection can continue and the backlog can be forwarded later.

This protects data only when the collector can still reach the source. It does not reconstruct OPC UA notifications that the collector never received. Placing the collector or agent on the OT side of an unreliable WAN can therefore change the failure boundary: the local source link stays available while the buffered historian link is allowed to fail.

Size persistent storage for the worst expected outage, including peak update rates and the time needed to drain the backlog while new data continues to arrive. Monitor free disk space and backlog age. A full disk turns a recoverable interruption into permanent loss.

Why reconnecting is not the same as recovering

After reconnecting, an OPC UA client may reactivate its session, transfer a subscription, republish missed messages, or create a new subscription. The last option restores current collection but may leave the outage window empty.

A read of the latest value also does not fill the gap. It proves the current state only. If a temperature changed five times during the outage and the client reads one value afterward, the intermediate history is still missing.

To recover a longer window, you need one of these sources:

- Retained notifications that the client can republish.

- A durable subscription supported and configured on both sides.

- Historical data exposed by the OPC UA server and an explicit backfill process.

- A persistent edge or collector buffer that received the values during the outage.

Without one of those records, the missing values cannot be recreated reliably. Interpolation may help a report, but it must remain distinguishable from observed data.

Build a recovery test around evidence

Test the complete path before relying on it in production. Use a safe point with a known update pattern, then interrupt each network segment separately.

Record the last source timestamp and subscription sequence before the outage. Confirm whether the source keeps changing and the persistent backlog grows. After recovery, check for sequence gaps, overflow, duplicates, late arrivals, and backlog drain time.

Compare the historian with the expected source record for the outage window. For periodic signals, compare expected and actual sample counts. For change-based signals, compare source events or server history with stored transitions. Keep source and receipt time where practical so late recovery can be separated from real-time ingestion.

Applying this design to TDengine

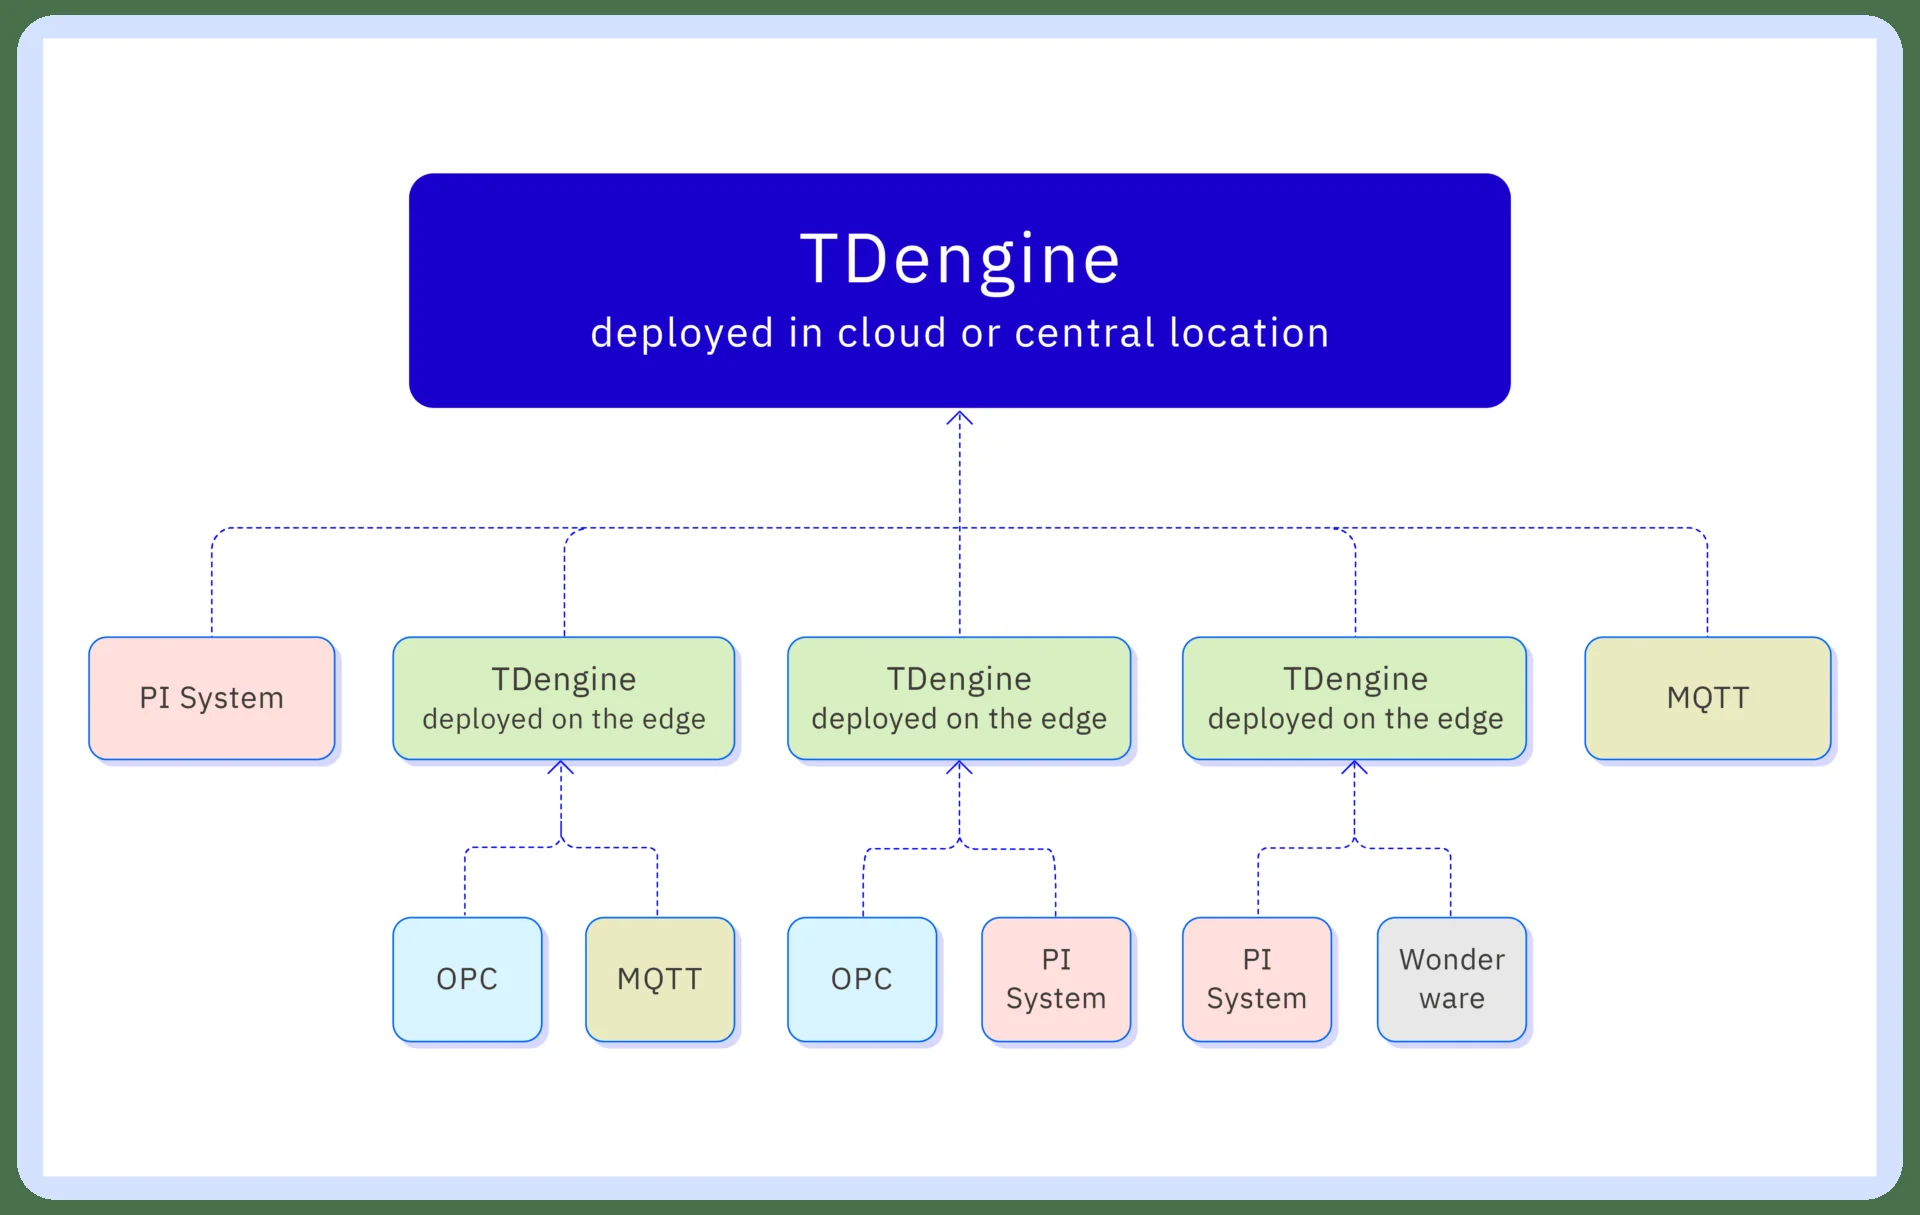
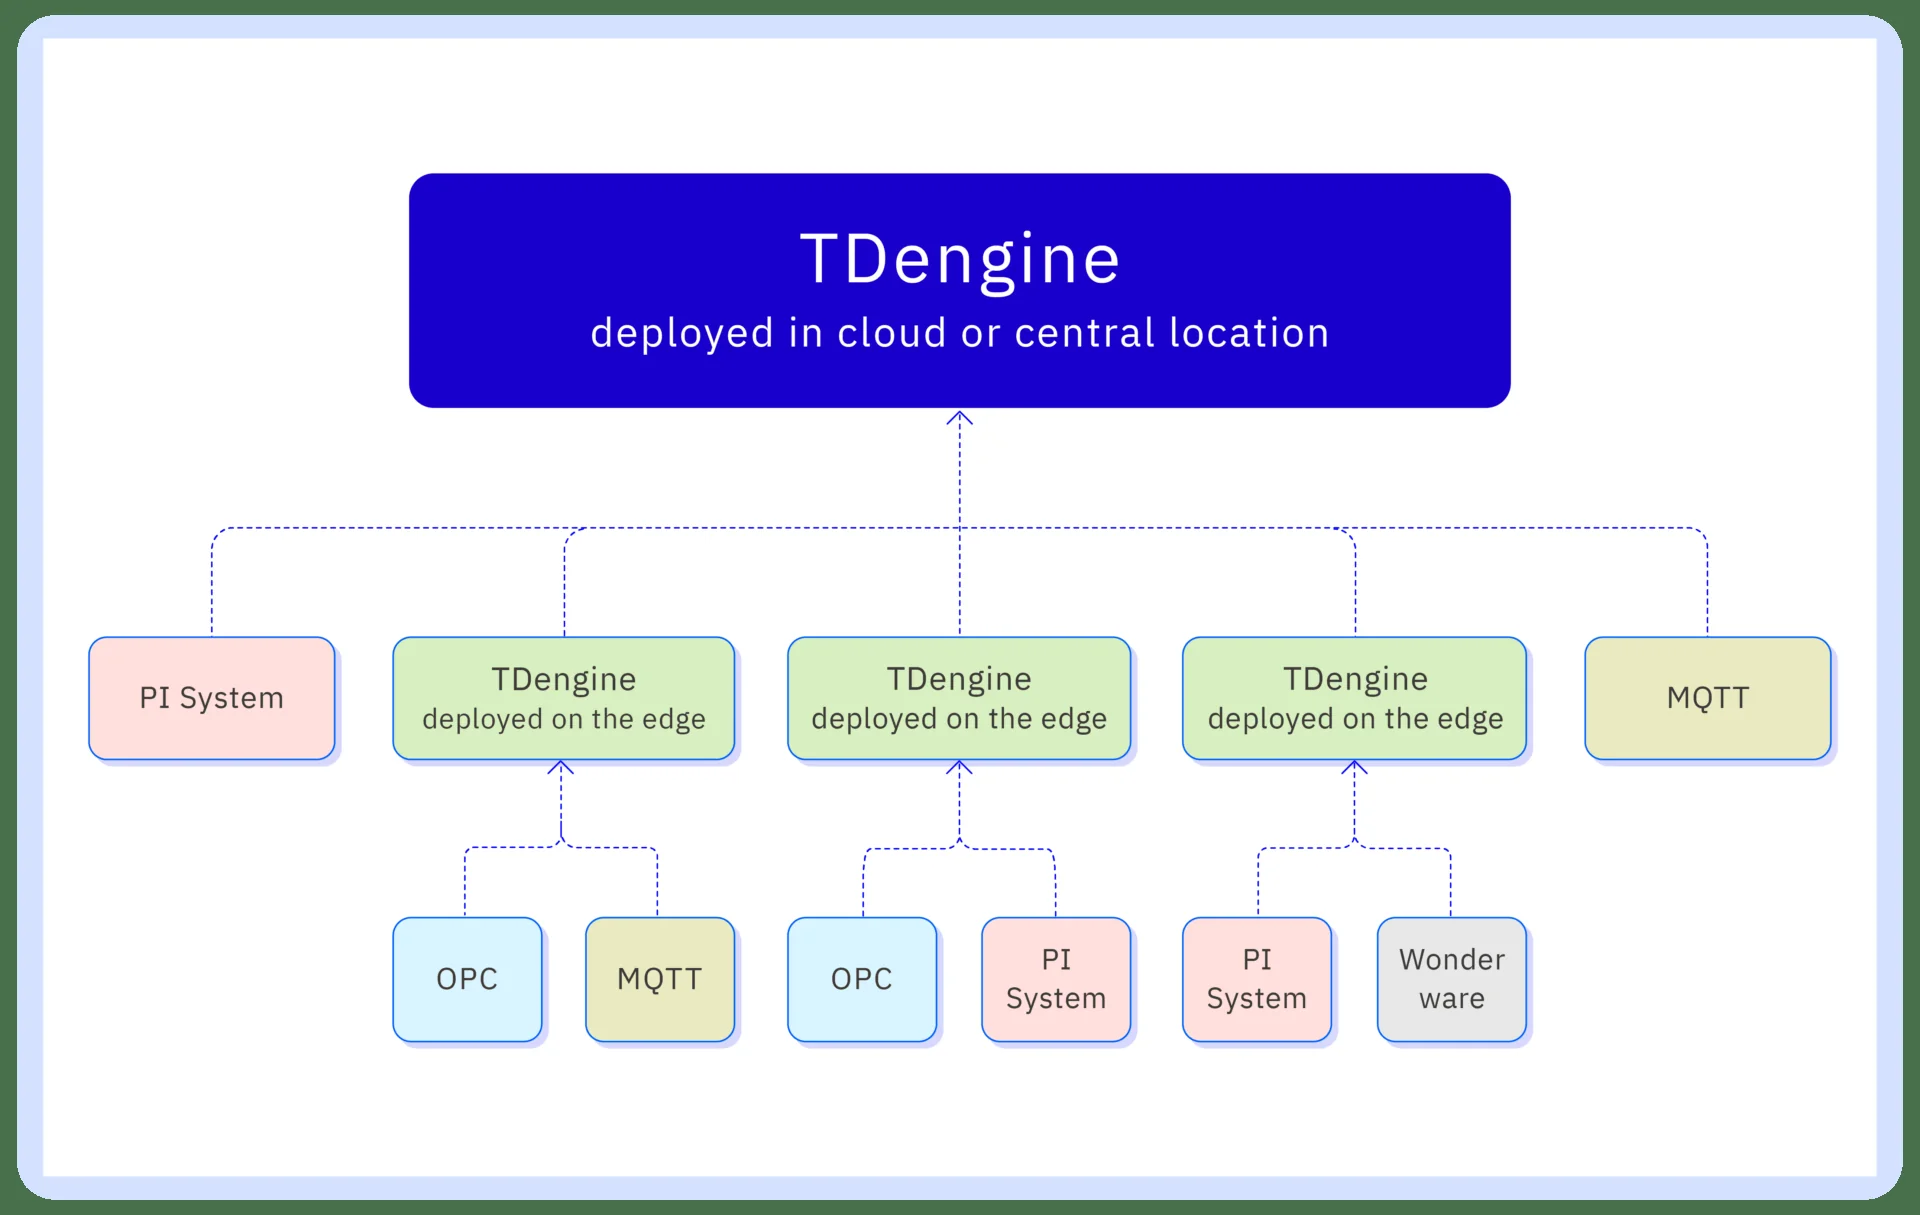
TDengine TSDB-Enterprise can ingest OPC UA data through taosX, with taosX-Agent available when the OPC UA server is reachable from an OT-side host but not directly from taosX. That placement can keep the agent-to-source link local while data travels from the agent to taosX across the less reliable network.

For OPC UA real-time collection tasks using taosX-Agent, TDengine documents a Store and Forward option called Cache Real-time Data. It is disabled by default. When enabled, the agent writes collected messages to a disk-based persistent queue, resumes from its last confirmed breakpoint after a network recovery or agent restart, and removes cache files after confirmed delivery. The feature covers interruptions between taosX-Agent and taosX while the agent continues to collect from the source.

That boundary is important. TDengine’s local cache does not by itself recover values missed when the agent cannot reach the OPC UA server. For that failure, recovery still depends on OPC UA subscription retention, server history, or another source-side record.

Use the cache directory on a monitored disk with enough capacity for the planned outage window. TDengine notes that persistence adds write and read work, so include recovery latency and backlog drain time in the acceptance test.

Once the data reaches an industrial time-series database, verify completeness by timestamp range and point rather than by task state alone. The operating target should be explicit: maximum recoverable outage, permitted loss, maximum backlog age, and the evidence used to declare recovery complete.

For more on how subscriptions compare with periodic reads, see our guide to OPC UA polling versus subscription.

Class (B2B/B2C)
B2B
Ingest Status
Rewritten
Dedupe hash
31f19f4b9f081c54f8fa16bd3cd41a5b
Press Eligible
Yes
Press Eligible Reason
Manuelle Prüfung nötig. Risiko: MEDIUM. Flags: ['none']. Stichprobe: False
Source Name
TDengine
Original Summary

An OPC UA connection can recover after an outage while the historian still has a hole. Reconnection restores communication. It does not prove that every value generated during the interruption survived. Preventing OPC UA data gaps starts with identifying which link failed. A typical path has three responsibilities: the source creates or exposes measurements, the ... <a class="read-more" href="https://tdengine.com/prevent-opc-ua-data-gaps-network-outages/&quot; title="How to Prevent Data Gaps in OPC UA Collection During Network Outages">Read more</a>

Image URL
https://eujqw4hwudm.exactdn.com/wp-content/uploads/nh-0326-02.png
Source Node
Content Hash (SHA-256, erste 32 hex)
598d3651302e0f26326281c1ca9a3652
OPC UA vs. MQTT for Industrial Data Collection: When to Use Each
Image File
Original HTML

Choose OPC UA when the collector needs to discover and read a structured industrial source. Choose MQTT when producers need to publish messages through a broker to one or more consumers. Use both when the plant-facing interface and the upstream distribution problem are different.

That rule is only a starting point. OPC UA is a family of specifications that includes Client/Server services, information modeling, Alarms and Conditions, Historical Access, and PubSub. MQTT is a lightweight publish/subscribe messaging protocol. Comparing a typical OPC UA Client/Server connection with an MQTT broker architecture is useful, but the two names do not describe equivalent layers.

The practical differences

Actual products can support only part of either standard. Check profiles, protocol versions, authentication methods, data models, queue behavior, and limits before choosing an architecture.

OPC UA carries an industrial information model

An OPC UA server can organize measurements under equipment objects, attach engineering units and ranges, expose status and timestamps, define methods, and use companion specifications for industry-specific models. A client can browse that address space and select nodes without requiring every meaning to be encoded in a topic string.

This is valuable when the source system already provides context that the collector should preserve. For example, a plant collector may browse a packaging-line server, identify each motor’s speed and running state, and subscribe to those variables. The choice between reads and monitored-item subscriptions is covered in the OPC UA polling versus subscription guide.

OPC UA does not guarantee that every server has a rich or consistent model. Some expose flat tag lists, incomplete metadata, or vendor-specific structures. Security also depends on endpoint configuration, certificate trust, user identity, and authorization. The presence of OPC UA does not make a deployment secure by itself.

MQTT moves application messages through topics

MQTT clients publish messages to topic names. The broker routes them to matching subscribers. A device or edge application chooses the topic structure and payload, which might be JSON, binary data, or another agreed format.

Core MQTT does not define an OPC UA-style equipment address space or industrial semantic model. Teams need a schema, naming convention, units policy, timestamp fields, and versioning rules if downstream consumers require consistent meaning. This extra design work can be reasonable when the publisher already knows exactly what telemetry it must send.

The broker pattern works well for distributed sites. A site gateway can publish selected telemetry upstream without allowing every central consumer to connect to each plant source. Multiple authorized applications can subscribe without adding a separate OPC UA session to the source for each consumer.

MQTT does not require an Internet connection. A broker can run on premises, at an edge site, in a data center, or in a cloud environment. Routing and security policy determine who can reach it.

Delivery settings do not create a historian

MQTT Quality of Service describes message delivery between one sender and one receiver in a protocol flow:

- QoS 0 is at most once.

- QoS 1 is at least once and can produce duplicates.

- QoS 2 is exactly once for that delivery flow.

These levels do not guarantee that an application wrote a unique, durable historian record. The publisher, broker, subscriber, mapping logic, and database can each fail outside that flow.

A retained MQTT message is the broker’s stored current message for a topic, delivered to future matching subscribers. It is not a time series. Persistent sessions can preserve subscriptions and pending QoS 1 or QoS 2 messages within configured session expiry and broker resource limits. They are not the same as end-to-end historical backfill.

OPC UA Client/Server subscriptions also use queues and retransmission mechanisms. Durable Subscriptions and Historical Access exist, but support is implementation-dependent. Neither protocol can recover values that the source or edge application never captured.

For either choice, define outage boundaries. Test a device disconnect, edge restart, broker or server restart, network partition, subscriber outage, queue overflow, and storage failure. Record where data is buffered, when it expires, how duplicates are identified, and how gaps appear.

Security depends on the deployment

OPC UA can use application certificates, signed or encrypted SecureChannels, and user authentication. MQTT deployments can use TLS, client certificates or credentials, and broker access-control lists. Both can also be deployed with weak settings.

Review the complete path: certificate lifecycle, credential storage, topic or node permissions, firewall rules, software updates, logging, and incident isolation. Encryption protects data in transit but does not correct an overprivileged account or a compromised endpoint.

When to choose OPC UA, MQTT, or both

OPC UA is a reasonable default when the source already exposes an OPC UA server and the application needs browsing, source metadata, equipment relationships, alarms, or methods. It keeps the collector close to the source’s industrial model.

MQTT is a reasonable default when devices or gateways publish a defined telemetry payload, a broker is part of the managed architecture, and several consumers need decoupled access. It also suits constrained or intermittent links when the selected clients and broker have tested queue and session behavior.

Using both can separate collection from distribution. An edge component may act as an OPC UA client inside the plant, select and normalize source data, then publish an approved payload to an MQTT broker for upstream consumers. That bridge must define timestamp, quality, identity, units, retry, and duplicate behavior. The existence of both protocols does not supply those rules automatically.

OPC UA PubSub can also use MQTT as a transport mapping. That is not the same as publishing an arbitrary JSON payload from a custom gateway. Confirm that the publishers and subscribers support the same OPC UA PubSub profiles, encoding, security, and information model.

TDengine collection paths

TDengine TSDB Enterprise documents separate ingestion connectors for OPC UA and MQTT. OPC UA tasks collect points or Alarms and Events from a server. MQTT tasks subscribe to broker topics, parse message payloads, and map fields into TDengine tables. The current TDengine MQTT ingestion guide documents broker connection, supported protocol versions, topic QoS, TLS options, and payload mapping.

These connectors provide two source paths into TDengine TSDB. The documentation does not state that they translate OPC UA traffic into MQTT or make the two protocols interoperable. If an architecture uses both, define and operate the bridge separately unless a documented component explicitly provides it.

Class (B2B/B2C)
B2B
Ingest Status
Rewritten
Dedupe hash
052b9a1e12cc8614b56829e1e059ce90
Press Eligible
Yes
Press Eligible Reason
Manuelle Prüfung nötig. Risiko: MEDIUM. Flags: ['none']. Stichprobe: False
Source Name
TDengine
Original Summary

Choose OPC UA when the collector needs to discover and read a structured industrial source. Choose MQTT when producers need to publish messages through a broker to one or more consumers. Use both when the plant-facing interface and the upstream distribution problem are different. That rule is only a starting point. OPC UA is a ... <a class="read-more" href="https://tdengine.com/opc-ua-vs-mqtt-industrial-data-collection/&quot; title="OPC UA vs. MQTT for Industrial Data Collection: When to Use Each">Read more</a>

Image URL
https://eujqw4hwudm.exactdn.com/wp-content/uploads/nh-0326-02.png
Source Node
Content Hash (SHA-256, erste 32 hex)
eb7b6964c0813103275c03e4c38c8daf
OPC UA Alarms and Events vs. Tag History: What Should Your Historian Capture?
Image File
Original HTML

A pressure trend can show when a pump moved outside its normal range. It cannot, by itself, show which alarm object changed state, what severity the server reported, or when an operator acknowledged that alarm.

Those answers come from different OPC UA records. Ordinary tag history stores sampled or reported variable values. OPC UA Events report occurrences. Alarms and Conditions add a stateful model for conditions that can become active, return to normal, require acknowledgment, or retain previous branches. A useful historian design starts by deciding which questions each record must answer.

Tag history preserves process behavior

An OPC UA client normally collects a variable through a monitored item. When the value or status meets the configured DataChange criteria, the server sends a DataChange notification containing a DataValue. The historian can store the value, source timestamp, server timestamp, and StatusCode, depending on the collector mapping.

That record is suited to questions such as:

- How high did discharge pressure rise?

- How long was the motor running?

- Did temperature change before the trip?

- Was the value Good, Uncertain, or Bad?

Sampling, deadbands, queues, and timestamp selection determine how much of the process behavior survives. The earlier guide to OPC UA timestamps in historian storage explains why the source, server, and receipt times should not be treated as one clock.

Events preserve occurrences and their context

OPC UA Events are not ordinary value changes with a different label. A client monitors an EventNotifier and uses an EventFilter to select the event types, sources, and fields it wants returned.

Fields defined by the OPC UA event model can include:

- EventId and EventType, which identify the notification and its type.

- SourceNode and SourceName, which identify where it originated.

- Time, which is set as close to the event generator as possible.

- ReceiveTime, which records when the OPC UA server received the event.

- Message and Severity, which provide human and priority context when the event type supplies them.

The historian’s ingestion timestamp is a separate time. It may help diagnose transport delay, but it should not silently replace the event’s occurrence time. Preserve both when delay analysis matters.

An ordinary Event can be a one-time occurrence, such as a system start or an audit action. It does not need to represent an ongoing abnormal state.

Alarms and Conditions add state and operator workflow

The OPC UA Alarms and Conditions model extends the base Event model. A Condition represents a stateful situation associated with a source. Alarm types add state related to abnormal process behavior.

Depending on the alarm type and server implementation, an event notification can carry information such as ConditionId, BranchId, ActiveState, AckedState, ConfirmedState, Retain, limits, comments, and the user associated with an action. EventId identifies a specific event notification and is used when acknowledging or confirming the relevant condition state.

This distinction matters because one alarm occurrence can produce several records. A high-pressure condition may become active, be acknowledged, return to normal, and later be confirmed. Each transition changes the investigation timeline. If rapid changes create previous unacknowledged states, Condition branches can preserve those states until the required action occurs.

Not every server supports every alarm type, field, branch behavior, or method. The client also receives only the fields selected through its EventFilter. Confirm the server and collector behavior rather than assuming a complete alarm model is present.

Why a Boolean alarm tag is incomplete

A Boolean HighPressureAlarm tag can show false, then true, then false. That is useful, but it usually cannot answer:

- Which event occurrence was acknowledged?

- Did severity or message change while the alarm remained active?

- Who acknowledged it, when, and with what comment?

- Was a previous condition branch still awaiting action?

- Did a queue overflow or filter omit a transition?

A Boolean trend also depends on variable sampling and queue configuration. A short state transition can disappear if the collector never receives it. Native alarm records identify transitions in the condition lifecycle rather than reducing that lifecycle to one current-state value.

Keep the Boolean tag when it helps dashboards or simple queries. Do not treat it as a replacement for event and alarm records when acknowledgment or sequence reconstruction is required.

Pump incident: what each record explains

Consider a pump whose discharge pressure rises above a configured limit. The alarm activates at 10:14:02. An operator acknowledges it at 10:14:20. Pressure returns to normal at 10:15:07.

Pressure and motor-status history can show the process trajectory: the peak, how long pressure remained high, whether the motor stopped, and whether the reading quality changed. It cannot prove that the server issued an alarm, identify the alarm severity, or show the acknowledgment action.

Alarm records can show the active transition, EventId, source, message, severity, acknowledgment transition, user context if provided, and return-to-normal transition. They may not contain the full high-resolution pressure waveform. A sound incident record therefore keeps both the process series and the selected alarm lifecycle fields.

Subscription is not the same as event history

An event subscription normally reports transitions after monitoring begins. ConditionRefresh can request the current retained Condition states so a client can rebuild a current alarm display after connecting. It is not a general replay of every earlier event.

OPC UA Historical Access defines services for reading stored Events from servers that expose historical event nodes. Support and retention are optional. A server that produces live alarm notifications does not automatically keep a queryable event archive. The collector must also support the required historical access if backfill is part of the design.

Write the recovery requirement explicitly: live transitions only, current retained states after reconnect, or historical event backfill. Then test that exact behavior.

Validate the historical record before an incident

Use a controlled alarm lifecycle and compare the OPC UA client view with stored rows. Confirm that the selected fields retain event identity, source, event time, receive or ingestion time, severity, message, condition state, and acknowledgment context required by the site.

Test reconnects, client restarts, server restarts, queue pressure, and duplicate timestamps. Verify whether current states are refreshed, older transitions are replayed, duplicates are handled, and missing records are visible. Finally, run the investigation query that engineers will use. A complete source payload is not useful if the storage schema or query discards its distinguishing fields.

Capturing OPC UA alarms and events in TDengine

TDengine TSDB Enterprise documents a dedicated OPC UA Alarm and Event collection mode in taosX. The current OPC UA Alarm and Event collection guide describes subscriptions with EventFilters, separate handling for ordinary Events and Alarms, one stored row per alarm state transition, and fields selected from the event type.

That capability is different from ordinary point collection. It also depends on what the server exposes and what the task selects. Validate the resulting schema and lifecycle against the source before relying on it for investigations.

For teams building an industrial historian on a time-series database, keeping process values and alarm transition records available for correlation preserves more of the incident than either record type alone.

Class (B2B/B2C)
B2B
Ingest Status
Rewritten
Dedupe hash
0be44b892304a081b9d08b9d38737e8e
Press Eligible
Yes
Press Eligible Reason
Technical guidance on OPC UA historian data capture for industrial teams, with enterprise software context.
Source Name
TDengine
Original Summary

A pressure trend can show when a pump moved outside its normal range. It cannot, by itself, show which alarm object changed state, what severity the server reported, or when an operator acknowledged that alarm. Those answers come from different OPC UA records. Ordinary tag history stores sampled or reported variable values. OPC UA Events ... <a class="read-more" href="https://tdengine.com/opc-ua-alarms-events-vs-tag-history/&quot; title="OPC UA Alarms and Events vs. Tag History: What Should Your Historian Capture?">Read more</a>

Image URL
https://eujqw4hwudm.exactdn.com/wp-content/uploads/nh-0326-02.png
Source Node
Content Hash (SHA-256, erste 32 hex)
136ace4494874e12a15da33781ef32b2
OPC UA Data Quality Codes: Why They Matter for Historical Analysis
Image File
Original HTML

A historian can store a valid timestamp and a numeric value even when that value should not be used in an average, alarm review, or production calculation. The missing context is often the OPC UA StatusCode carried with the value.

OPC UA data quality codes tell the client about the conditions under which a value was produced and whether it is usable. If the collector drops that information, downstream users may treat a stale, substituted, or otherwise questionable number as an ordinary process measurement.

StatusCode is more than a Good, Bad, or Uncertain label

Every OPC UA DataValue can contain a value, timestamps, and a StatusCode. The StatusCode is a 32-bit value. Its severity class is Good, Uncertain, or Bad, but the remaining bits can carry a more specific code and added information.

- Good means the operation succeeded and the associated result may be used.

- Uncertain means the result may not be suitable for every purpose. The subcode explains why.

- Bad means the value is not usable for the reason indicated by its subcode.

That severity check is the minimum. A historian integration should not collapse every non-Good condition into one generic flag if the detailed code matters to operations. Subcodes can distinguish different failure or uncertainty conditions. Information bits can also report conditions such as monitored-item queue overflow, limit state, or changed semantics.

The SemanticsChanged bit deserves attention. It can indicate that metadata such as engineering units changed and should be read again before the value is processed. A value of 100 is not comparable with yesterday’s 100 if the unit or scale changed between them.

A stored number is not automatically a usable measurement

Suppose a pressure transmitter normally reports around 5 bar. Communication to the device fails, but the historian path continues to write a numeric value without its quality status. A trend may look flat and stable. An hourly average may include that number. An investigator may conclude that the process was steady during the outage.

The problem is not that the historian failed to receive a row. It received an incomplete representation of the measurement. The source quality, value, and timestamp belong together.

Uncertain data requires a policy rather than a universal rejection rule. A value marked Uncertain may still help an operator understand direction or continuity, while being unsuitable for custody transfer, compliance reporting, or a production total. The subcode and business use determine the decision.

Bad values are clearer: OPC UA says they are not usable. A downstream calculation should not quietly treat a Bad value as a normal sample. Depending on the application, it may exclude the sample, return a quality-aware result, or stop the calculation and flag the interval.

Quality changes what historical calculations mean

Quality handling affects more than charts.

Avoid simply deleting every non-Good row at ingestion. Deletion removes evidence that the source or communication path had a problem. It is often better to preserve the received record and its quality, then apply use-specific rules in queries or curated datasets.

Preserve raw quality and define a usable-data rule

A durable historian design separates collection truth from analytical policy. If the collector provides the full StatusCode, retain its raw form when practical. A derived severity field can make routine filtering easier, but it should not replace the detailed code.

Document at least four decisions:

- Which source StatusCode field enters the collector?

- Which raw or derived quality field reaches historian storage?

- Which severities and subcodes each calculation accepts?

- How reports identify excluded, uncertain, or missing intervals?

Do not invent a value when the source has no usable measurement. Interpolation and carry-forward logic can support visualization or analysis, but mark the result as calculated or substituted. Otherwise the historian can no longer distinguish an observed value from an estimate.

Quality policy should also address late corrections. If a source sends a revised value or metadata change, decide whether historical calculations are recomputed and how the correction remains auditable.

Verify quality across the full path

Test one point before rolling the design across thousands of tags. Use an OPC UA client to record the source value, timestamp, full StatusCode, and readable status name. Compare that with the collector’s raw record and the destination row.

In a controlled test environment, create known Good, Uncertain, and Bad conditions where the server supports them. Confirm that the historian representation changes as expected. Also check a queue-overflow or semantic-change condition if those cases matter to the application.

Then run the downstream query. An average that excludes Bad data should produce a different result from an unfiltered average when the test window includes a Bad sample. A trend should make the quality transition visible. This proves that the status survived storage and that users actually handle it.

If the OPC UA connection works but records are missing from the historian, use this OPC UA troubleshooting guide to trace the collection and write path.

OPC UA quality mapping in TDengine

TDengine TSDB-Enterprise supports OPC UA ingestion through taosX. The current OPC UA CSV mapping reference includes an optional quality_col field. When configured, it names the TDengine column that stores OPC quality. Leaving it empty means the mapping does not add that quality column.

The documentation confirms the mapping field but does not state that every OPC UA StatusCode subcode and information bit is decoded into separate historian fields. Do not assume that level of preservation. Inspect the actual value written by the connector version in use, compare it with the source StatusCode, and document any transformation before building quality filters.

For industrial data stored in a time-series database, keeping value, timestamp, and quality together gives queries enough context to distinguish received data from usable data. The query or application still needs an explicit policy for Bad and Uncertain samples. Storage alone does not decide whether a measurement belongs in a particular calculation.

Class (B2B/B2C)
B2B
Ingest Status
Rewritten
Dedupe hash
def49a5b1bdb6be573dfc47c9f1951a6
Press Eligible
Yes
Press Eligible Reason
Manuelle Prüfung nötig. Risiko: MEDIUM. Flags: ['numbers']. Stichprobe: False
Source Name
TDengine
Original Summary

A historian can store a valid timestamp and a numeric value even when that value should not be used in an average, alarm review, or production calculation. The missing context is often the OPC UA StatusCode carried with the value. OPC UA data quality codes tell the client about the conditions under which a value ... <a class="read-more" href="https://tdengine.com/opc-ua-data-quality-codes-historical-analysis/&quot; title="OPC UA Data Quality Codes: Why They Matter for Historical Analysis">Read more</a>

Image URL
https://eujqw4hwudm.exactdn.com/wp-content/uploads/nh-0326-02.png
Source Node
Content Hash (SHA-256, erste 32 hex)
b248084a06b771e6ee9930a5fee9b3e8
OPC UA Sampling Intervals and Deadbands: How Much Data Should You Collect?
Image File
Original HTML

The right OPC UA collection rate is the slowest configuration that still preserves the process behavior needed for operations and historical analysis. That rate is not one number. Device updates, server sampling, subscription publishing, filtering, and historian storage are separate stages.

Treating them as a single “scan rate” can create two opposite problems. An aggressive request may add server and collector load without revealing any new information. A slow request or a wide deadband may hide a pressure transient or short state change that the historian was expected to explain.

Start with the five rates in the data path

These stages interact, but none replaces another. A PLC may update a temperature every 500 milliseconds while the OPC UA server refreshes its internal value once per second. Asking the server to sample every 100 milliseconds will then read the same underlying value repeatedly or detect changes no sooner than the server makes them available.

Sampling and publishing solve different timing problems

An OPC UA monitored-item sampling interval tells the server how frequently it should check the underlying source for a change. The specification describes this as a best-effort cyclic rate. A request of zero means the fastest practical rate, not an unlimited or guaranteed rate.

Servers commonly support a limited set of intervals. When a client creates or modifies a monitored item, the server can return a revised sampling interval. The client should use the revised value as the actual agreement. The server can likewise revise the requested publishing interval to meet its constraints.

The publishing interval belongs to the subscription. At each cycle, the subscription attempts to send notifications that monitored items have generated and queued. Sampling can therefore occur several times within one publishing interval. The later publication may group those notifications, subject to queue size and other subscription limits.

A shorter publishing interval can reduce delivery latency, but it does not make the source update faster. A shorter sampling interval can improve change detection only when the source and server can supply useful changes at that rate.

Deadbands decide which numeric changes become notifications

An OPC UA DataChangeFilter can suppress small numeric value changes while still reporting changes that meet its trigger rules. This filtering happens before the historian receives the notification, so the historian cannot reconstruct suppressed samples later.

OPC UA defines three deadband types:

- None applies no deadband calculation.

- Absolute compares the magnitude of the current value change with a configured value in the measurement’s units. A change is reported when it is greater than the absolute deadband.

- Percent calculates the threshold as a percentage of the item’s EURange. It applies to AnalogItems that provide that engineering-unit range.

For example, a 1 percent deadband on an EURange of 0 to 200 bar produces a threshold of 2 bar. That is not 1 percent of the current reading. If EURange is missing or does not represent the intended operating range, the percentage setting is unavailable or may produce an unsuitable threshold.

Deadbands are not a general-purpose setting for every value. The OPC UA absolute deadband applies to numeric variables. A Boolean motor-running state has no useful numeric noise band. Its important information is the transition itself. Status changes are also not suppressed merely because a value falls within a deadband.

Tune settings to the measurement, not the tag count

There is no safe universal interval for any of these classes. A temperature used for long-term energy analysis may tolerate slower collection than the same temperature used for trip investigation. A pressure average may look correct even when a damaging one-second excursion was never collected.

Define the evidence requirement first. Ask for the shortest event duration, maximum acceptable detection delay, smallest meaningful value change, and calculations that will use the data. These requirements provide a defensible basis for timing and filtering.

More samples can create load without more information

Short sampling intervals increase the number of evaluations the server may perform. Tight deadbands can generate more notifications. Short publishing intervals can increase message frequency. Across thousands of points, those choices affect server CPU, subscription queues, network traffic, collector processing, and historian writes.

The answer is not to filter everything aggressively. Upstream filtering trades data volume for irreversible information loss. Use it when measurement noise is understood and the suppressed changes are demonstrably irrelevant to the intended use.

Also inspect the values the server actually grants. A configuration screen may show the requested sampling or publishing interval while the server is operating at a revised value. Record both during commissioning.

Prove the configuration with a controlled test

Test representative signals under normal and abnormal operating conditions:

- Capture a trusted high-resolution reference from the controller, server, or test instrument.

- Record requested and revised OPC UA sampling and publishing settings, plus filter and queue settings.

- Generate known ramps, small oscillations, fast transients, and state transitions where the process permits.

- Compare event timing, peaks, transition counts, averages, and totals in the collected history with the reference.

- Observe server, network, collector, and storage load before expanding the configuration.

Repeat the test after firmware, server, or collector changes. A configuration that was adequate for a slow process may fail after the control strategy or analysis requirement changes.

Where TDengine fits in the collection path

TDengine TSDB-Enterprise OPC UA ingestion supports subscribe mode, in which the server reports data changes, and observe mode, in which the task polls at a configured collection interval. The current OPC UA ingestion documentation states that the observe interval is task-level and that subscribe mode does not scan every point on a fixed interval.

The documentation does not describe a taosExplorer control for OPC UA monitored-item sampling intervals, publishing intervals, or deadbands. Verify those settings in the OPC UA server and the connector version in use rather than assuming the ingestion task exposes them.

Once values reach an industrial time-series database, retention, downsampling, and query design can manage stored data for different consumers. Those downstream choices cannot restore a transient that source sampling or a deadband never reported. Collection tuning therefore needs to be validated before storage optimization begins.

Class (B2B/B2C)
B2B
Ingest Status
Rewritten
Dedupe hash
f354c643ca85252259b2b2f9b18b59c9
Press Eligible
Yes
Press Eligible Reason
Manuelle Prüfung nötig. Risiko: MEDIUM. Flags: ['none']. Stichprobe: False
Source Name
TDengine
Original Summary

The right OPC UA collection rate is the slowest configuration that still preserves the process behavior needed for operations and historical analysis. That rate is not one number. Device updates, server sampling, subscription publishing, filtering, and historian storage are separate stages. Treating them as a single &#8220;scan rate&#8221; can create two opposite problems. An aggressive ... <a class="read-more" href="https://tdengine.com/opc-ua-sampling-intervals-deadbands/&quot; title="OPC UA Sampling Intervals and Deadbands: How Much Data Should You Collect?">Read more</a>

Image URL
https://eujqw4hwudm.exactdn.com/wp-content/uploads/nh-0326-02.png
Source Node
Content Hash (SHA-256, erste 32 hex)
e1fdd145381de18bef4cd7124ca5de4f
How to Map OPC UA NodeIds to Equipment and Asset Names
Image File
Original HTML

An OPC UA NodeId can tell a client exactly which node to read. It does not necessarily tell an engineer which pump, line, or measurement that node represents in the plant.

Reliable OPC UA NodeId mapping keeps source identity separate from the names people use. The source identifier, browse path, equipment identity, and user-facing label should remain connected, but they should not be treated as the same field.

NodeId, BrowseName, and DisplayName have different jobs

A NodeId unambiguously identifies a node in an OPC UA server’s address space. It combines a namespace reference, identifier type, and identifier. The identifier can be numeric, a string, a GUID, or opaque data.

A BrowseName is a nonlocalized name used to browse the address space and construct browse paths. It includes a namespace and a string, but it is not unique across the entire server. Different nodes can have the same BrowseName.

A DisplayName is a localized label intended for users. The same node can return different DisplayName text for different session locales. Display names may also be repeated. They are useful in an interface, not as the sole identity for an integration.

Store the namespace URI along with the index

A NodeId written as ns=4;s=Pump01.DischargePressure uses 4 as an index into that server session’s NamespaceArray. The index is compact for transport, but the OPC UA specification allows it to change in a later session. The namespace URI is the stable meaning behind the index.

For a maintainable mapping, retain the server or endpoint identity, namespace URI, identifier type, and identifier. Resolve the current namespace index when connecting. A stored ns=4 string without its URI can point to the wrong namespace after the server’s table changes.

OPC UA requires a server to persist the identifier type, identifier, and namespace URI for a node. Operational changes still need reconciliation. A vendor import, server replacement, or delete-and-recreate operation may expose a different node even if its label looks unchanged. Treat configuration changes as mapping changes to validate, not as proof that every identifier will survive.

Give equipment its own stable identity

Do not make a raw NodeId the equipment name. Use an internal asset key that belongs to the plant’s naming system, such as a controlled equipment number. Map each source point to that asset and to a defined attribute.

For one pump in a group of similar pumps, the mapping might look like this:

Pumps P-102 and P-103 can use the same attribute template while binding to their own source nodes. The template standardizes names, data types, and engineering units. The mapping supplies the source identity for each equipment instance.

This is safer than inferring the plant hierarchy from a tag string alone. A string such as Pump01.Temp does not prove the plant, area, equipment type, or meaning of Temp. Those relationships need controlled metadata or an approved mapping rule.

Keep source, semantic, and display fields separate

A practical mapping record should retain:

- Source identity: endpoint, namespace URI, identifier type, and identifier.

- Browse context: browse path, BrowseName, and source description.

- Asset identity: site, area, equipment key, and equipment class.

- Measurement definition: attribute name, engineering unit, and data type.

- Display metadata: operator-facing name and optional localized labels.

This separation lets a DisplayName change without breaking the source binding. It also lets a source node move to a new equipment binding through a controlled change rather than a silent rename.

Plan for mapping changes

Before a server or controller change, export the current point inventory and mapping. After the change, compare namespace URIs, NodeIds, browse paths, data types, and engineering units. Classify points as unchanged, moved, replaced, added, or removed.

Do not remap automatically on name similarity alone. Two pumps can expose identical BrowseNames under different parent objects. Require an equipment key, approved path rule, or reviewed exception for ambiguous matches.

At scale, version the mapping and keep an owner for each exception. Test a representative set of equipment classes before bulk rollout. Validation should confirm that every required attribute resolves to one expected source, units match the asset definition, duplicate bindings are intentional, and retired nodes are not still collecting under old names.

If a mapping change leaves an OPC UA connection active but no data reaches the historian, follow this OPC UA troubleshooting workflow to check node selection and data writes.

Mapping OPC UA data into TDengine IDMP

TDengine’s OPC UA ingestion mapping can write each point_id to TDengine TSDB and retain source metadata such as BrowseName, DisplayName, Description, and Path as tags. The path and readable names help with later modeling, but they do not replace a plant-approved asset key.

TDengine IDMP models physical or logical assets as elements in a hierarchy. Attributes can reference measurements stored in TDengine TSDB, and templates can standardize repeated equipment. The documented Import from OPC workflow applies when OPC-structured data is already stored in TDengine TSDB. It uses a selected path tag, data column, optional quality column, and path level to build the model.

That workflow does not prove that every source hierarchy is a correct business hierarchy. Review the imported structure, choose the right parent level, and reconcile source paths with equipment keys before users depend on it. For sites that need a governed asset hierarchy and reusable equipment templates, industrial data modeling in TDengine IDMP can provide the context above raw time-series tables.

Class (B2B/B2C)
B2B
Ingest Status
Rewritten
Dedupe hash
748704b28b75610190360e31bc659591
Press Eligible
Yes
Press Eligible Reason
Manuelle Prüfung nötig. Risiko: MEDIUM. Flags: ['none']. Stichprobe: False
Source Name
TDengine
Original Summary

An OPC UA NodeId can tell a client exactly which node to read. It does not necessarily tell an engineer which pump, line, or measurement that node represents in the plant. Reliable OPC UA NodeId mapping keeps source identity separate from the names people use. The source identifier, browse path, equipment identity, and user-facing label ... <a class="read-more" href="https://tdengine.com/map-opc-ua-nodeids-equipment-asset-names/&quot; title="How to Map OPC UA NodeIds to Equipment and Asset Names">Read more</a>

Image URL
https://eujqw4hwudm.exactdn.com/wp-content/uploads/nh-0326-02.png
Source Node
Content Hash (SHA-256, erste 32 hex)
2f8ea5087e024874acf5baef959b21a7
How to Collect OPC UA Data Across Segmented OT and IT Networks
Image File
Original HTML

An OPC UA client working beside the server proves that the endpoint and credentials can work locally. It does not prove that the same path should be opened from an enterprise historian into the control network.

For OPC UA OT IT network integration, begin with zones, conduits, and required data flows. Place collection components so they can reach the source without turning a protected OT segment into a broadly accessible network. Then secure and monitor each approved connection.

Segmentation protects more than confidentiality

Industrial organizations separate OT and IT because control systems have different availability, safety, change-management, and recovery requirements. Segmentation limits which systems can communicate and reduces the effect of a compromised account or host.

OPC UA protocol security contributes application authentication, message integrity, and confidentiality. Network controls contribute routing boundaries, firewall policy, inspection, monitoring, and isolation. One does not replace the other. An encrypted session can still travel through an overbroad firewall rule, terminate on a compromised collector, or use an account with excessive permissions.

NIST guidance for operational technology recommends security architectures that account for OT performance, reliability, and safety. The right design may use an industrial DMZ, a controlled interzone service, or another site-approved pattern. No single topology fits every plant.

Map the flows before choosing collector placement

A useful conceptual pattern is:

OT devices / PLCs

|

v

OPC UA server in an OT zone

|

v

Local collection agent

|

v

Approved firewall and interzone path

|

v

Central historian or industrial data platform

This diagram is a starting point, not a claim that the agent must sit on a PLC network or that every site needs the same DMZ. The detailed design should list each flow with its initiator, source and destination addresses, configured port, protocol, security mode, identity, and operational owner.

Do not assume that every OPC UA endpoint uses one fixed port. The endpoint URL identifies a transport and configured address, and vendor deployments can expose different endpoints. Discovery may also return a hostname or address that is reachable locally but not routable from another zone. Build firewall rules from the approved deployed configuration, not from a generic OPC UA port list.

Collector placement changes both reachability and risk

Three placement patterns are common:

Choose based on the site’s threat model, supported software, latency needs, maintenance model, and outage behavior. Avoid installing a collector directly on a controller or critical server unless the platform vendor and site policy explicitly support it.

Prefer the minimum required flows. When the collection product supports an agent that initiates an upstream connection, that can avoid a general inbound connection from IT to the agent. It does not eliminate the need to review the agent’s listening services, update path, credentials, host hardening, logs, and destination restrictions.

Treat OPC UA certificates and user identity separately

OPC UA applications use application certificates to authenticate peers and establish secure channels. A user token identifies the user or service account within the session. Both layers require deliberate configuration.

For production collection:

- Select a security policy and message security mode supported by both applications and allowed by site policy.

- Validate application certificates and trust lists; do not permanently accept unknown certificates to make commissioning easier.

- Use a dedicated, least-privilege identity that can read only the required nodes.

- Plan certificate issuance, renewal, revocation, backup, and time synchronization.

- Monitor rejected certificates and authentication failures as operational signals.

Certificate validation failures can appear after a hostname change, certificate renewal, trust-store reset, or clock problem. Disabling validation hides the symptom and removes a security control. Fix the trust relationship and endpoint configuration instead.

Separate reconnection, buffering, and historical recovery

Reconnection restores a communication session. It does not prove that values produced during the interruption were captured.

A local agent can buffer only data it actually received. If its OPC UA connection to the server fails, an upstream queue cannot invent the missing samples. If the agent continues collecting but cannot forward to the central platform, a persistent local queue may bridge that different failure, subject to disk capacity, retention behavior, ordering, and replay semantics.

OPC UA historical access is another recovery mechanism when the server supports it and the collection product uses it. Do not treat subscription reconnection, local buffering, and source-history backfill as interchangeable. Test each failure boundary separately and document where gaps remain possible.

For a closer look at outage recovery and data completeness, see our guide to preventing OPC UA data gaps during network outages.

Validate the architecture before production

Run a controlled commissioning test across the real network boundaries:

- Confirm name resolution, routes, endpoint URLs, and only the approved firewall flows from the actual collector host.

- Verify the negotiated OPC UA security policy, certificate identities, user permissions, and readable node scope.

- Measure normal latency and load, then test firewall closure, source restart, collector restart, and upstream interruption.

- Confirm alarms, logs, buffer limits, disk monitoring, replay order, duplicate handling, and the historian’s visible gap behavior.

- Record owners and procedures for certificate renewal, rule changes, software updates, backup, and incident isolation.

Include the OT security and operations teams in acceptance. A path that transfers data successfully but cannot be safely patched, monitored, or isolated is not production-ready.

TDengine taosX-Agent as a distributed collection option

TDengine TSDB Enterprise provides taosX-Agent for sources that taosX cannot reach directly. The current taosX-Agent reference states that the Agent is deployed near the source, initiates access to the data source, and initiates access to the taosX gRPC service. The documented default taosX gRPC port is 6055, but architects should use the configured endpoint and restrict the rule to the required hosts rather than treating a default as universal.

TDengine’s security documentation states that the taosX gRPC interface is unencrypted by default, although gRPC TLS is supported. For connections across network zones, explicitly enable and verify transport encryption alongside the site’s approved network controls.

TDengine also documents optional Store and Forward for supported real-time sources, including OPC UA. When enabled, the Agent persists collected data locally during an Agent-to-taosX interruption and resumes forwarding after recovery. It is disabled by default, uses disk space, and can increase end-to-end latency. It does not recover values the Agent never collected, and it does not promise zero loss under every failure.

The Agent provides a product-specific collection and forwarding path. It does not by itself define an industrial DMZ or satisfy a site’s security architecture. Teams still need to approve the zone placement, endpoint security, firewall flows, host controls, credentials, monitoring, and outage capacity.

For organizations centralizing industrial history in a time-series database, that separation is useful: properly configured OPC UA security protects the source session, the network architecture constrains communication, the Agent collects and may buffer data, and the database stores what successfully reaches it. Each layer needs its own verification.

Class (B2B/B2C)
B2B
Ingest Status
Rewritten
Dedupe hash
a15508e811afb4559b7855de48a1c9b5
Press Eligible
Yes
Press Eligible Reason
Manuelle Prüfung nötig. Risiko: MEDIUM. Flags: ['numbers']. Stichprobe: False
Source Name
TDengine
Original Summary

An OPC UA client working beside the server proves that the endpoint and credentials can work locally. It does not prove that the same path should be opened from an enterprise historian into the control network. For OPC UA OT IT network integration, begin with zones, conduits, and required data flows. Place collection components so ... <a class="read-more" href="https://tdengine.com/opc-ua-data-collection-segmented-ot-it-networks/&q…; title="How to Collect OPC UA Data Across Segmented OT and IT Networks">Read more</a>

Image URL
https://eujqw4hwudm.exactdn.com/wp-content/uploads/nh-0326-02.png
Source Node
Content Hash (SHA-256, erste 32 hex)
81d80f19ba01d6e1e6dc4242a009adff