5 Ways Alteryx and Snowflake Turn Data Into Business Results
Image File
Original HTML

Snowflake is the foundation for AI Data Cloud. It provides a governed, elastic ecosystem where enterprises run their AI directly against their data. Alteryx provides the business logic that turns data in Snowflake into trustworthy decisions. But storage and compute alone don’t close the books faster, catch a bad supplier before it hurts you, or give an executive an answer they can trust. That’s the gap between having data and getting value from it, and it’s exactly where Alteryx comes in.

Alteryx sits on top of Snowflake, pushing down transformation logic for performance while giving business users a no-code way to build, own, and govern the logic that turns raw data into decisions. The combination is simple: Snowflake stores and scales the data, Alteryx builds and governs the logic that makes it usable. Here are five use cases where that pairing delivers real, measurable business outcomes.

1. Financial close reconciliation that compresses weeks into days

Every month, finance teams pull transactions out of Snowflake, ERP feeds, general ledger entries, bank statements and try to match them by hand or with brittle spreadsheets. It’s slow, and every manual touchpoint is a chance for an error that shows up three weeks later in an audit.

With Alteryx connected directly to Snowflake, matching logic runs automatically: intelligent algorithms combined with business-defined rules reconcile thousands of transactions in a fraction of the time, and only genuine exceptions get routed to an analyst for review.

The business outcome: Close cycles that used to take weeks routinely compress to days, with every match decision fully explainable and audit-ready, no more scrambling to reconstruct “how did we get this number” for the auditors.

2. Supplier risk monitoring that gets ahead of disruption

Procurement teams often review supplier health quarterly, including financial stability, delivery performance, compliance status, using whatever data happens to be sitting in Snowflake at the time. By the time a risk shows up in that review, it’s already a problem.

Alteryx continuously blends financial data, delivery logs, quality reports, and external risk feeds housed in Snowflake, then applies governed scoring logic to flag suppliers showing early warning signs automatically, not once a quarter.

The business outcome: Supply chain teams move from reactive to proactive, catching risk signals weeks or months before a disruption hits production or triggers a compliance exposure.

3. Customer churn prediction that protects revenue before it walks out the door

Usage data, support tickets, payment history, and engagement metrics all land in Snowflake but stitching them together into a single, trustworthy churn signal is where most teams get stuck, often relying on a data science team with a multi-week backlog.

Alteryx unifies engagement, usage, support, and payment data from Snowflake into governed scoring logic that identify at-risk accounts early enough for customer success teams to act.

The business outcome: Customer success teams intervene before the cancellation email arrives, lifting retention rates and creating expansion opportunities the team wouldn’t have known to pursue.

4. Inventory optimization that frees up working capital

Too much inventory ties up cash. Too little creates stockouts that cost you the sale and the customer relationship. Most reorder calculations still run on outdated data and simple rules of thumb — even when sales, demand, and lead-time data already live in Snowflake.

Alteryx connects directly to Snowflake, pulling live sales trends, lead times, seasonality patterns, and demand forecasts straight into the workflow. As that data updates, so do your reorder points with alerts firing the moment action is needed.

The business outcome: Working capital drops as inventory levels are right-sized, while service levels improve because stockouts become the exception instead of the norm.

5. The business logic layer: Making AI on Snowflake data trustworthy

This is the use case that changes how you think about the other four.

Snowflake is an excellent place to store and query data at scale. But a data warehouse, no matter how powerful, doesn’t know your business logic and rules. It doesn’t know that “qualified pipeline” excludes deals stuck in stage 2 for 90+ days, or that a “reconciled transaction” has to pass four specific validation checks, or how your company defines an “at-risk account.” Without that logic made explicit, an LLM or AI agent querying Snowflake data can be left to guess, and guessing produces hallucinations, inconsistent answers, and outputs nobody can trust in front of a customer or a regulator.

This is where Alteryx functions as the business logic layer between Snowflake and every AI system, dashboard, or agent that depends on it. Business users, not just data engineers, build the transformation and validation rules directly in Alteryx, and those workflows become the governed, reusable source of truth that AI systems are grounded in.

We describe every Alteryx workflow using the VURA framework:

- Visible — the logic isn’t buried in someone’s SQL script or a departed analyst’s spreadsheet; it’s a workflow anyone can open and see.

- Understandable — built by business users in plain, visual steps rather than in code only an engineer can parse.

- Repeatable — the same inputs produce the same governed output, every single time, with none of the variance that comes from ad hoc manual work.

- Auditable — every transformation, calculation, and decision is logged and traceable back to its source.

The business outcome: AI and agentic analytics built on Snowflake data stop being a black box. Outputs are explainable, decisions can be traced back to the exact rule that produced them, and executives, auditors, and regulators get answers they can stand behind, not a probabilistic best guess.

Making it real

BODi

BODi, a fitness and wellness platform with over 2 million subscribers, struggled with siloed data across an on-premises warehouse, cloud storage, and a data lake—preventing a unified view of customers and delaying insights by up to 48 hours. By centralizing data ownership and adopting Snowflake’s AI Data Cloud alongside Alteryx for self-service analytics, BODi built a single source of truth spanning customer, distributor, and financial data, along with a Customer 360 view covering roughly 80 attributes and ML-driven scoring for loyalty and purchase propensity.

This modernized architecture now enables faster, more accurate promotions, actionable marketing KPIs tied to revenue, and flexible forecasting across finance, operations, and marketing teams, resulting in a 25% increase in subscribers.

Telenet

Telenet’s, a large Belgian telecommunications company, marketing team desired to deliver personalized campaigns. However, an outdated technology stack constrained them and couldn’t support the company’s growing marketing requirements. They moved their legacy environment to a modern cloud offering from Snowflake and AWS because it can grow and scale with their evolving business requirements. In addition, they adopted Alteryx as a low-code ETL and workflow solution that integrated seamlessly with their Snowflake/AWS cloud architecture, enabling business analysts to build, schedule, and run marketing workflows independently without relying on IT.

The results were significant because campaign development shrank from weeks to hours via automating campaign processes with Alteryx’s powerful workflow capabilities- a 90% time savings, while simultaneously increasing their NPS campaign reach by over 5%.

Read the Telenet Customer Story

Why this combination is worth your time

Snowflake gives you the foundation. Alteryx gives you the logic layer that makes that foundation usable by analysts, by dashboards, and now by the AI agents your organization is racing to deploy. The five use cases above aren’t hypothetical; they’re patterns showing up across finance, procurement, customer success, supply chain, and increasingly every team trying to make AI outputs something they can trust.

If your Snowflake investment is delivering storage and compute but not yet delivering governed, trustworthy business outcomes, that’s the gap Alteryx is built to close. Reach out to learn how the Alteryx One platform can turn your Snowflake data into decisions your business and your AI can rely on.

To learn more, visit us at Alteryx + Snowflake Cloud Analytics Partnership | Alteryx or contact us directly at Contact Alteryx Sales.


Class (B2B/B2C)
B2B
Ingest Status
Rewritten
Dedupe hash
e81e492ba5a8529c85bd0eb143aff13a
Press Eligible
Yes
Press Eligible Reason
Manuelle Prüfung nötig. Risiko: MEDIUM. Flags: ['numbers']. Stichprobe: False
Source Name
Alteryx, Inc.
Original Summary

Snowflake is the foundation for AI Data Cloud. It provides a governed, elastic ecosystem…

Image URL
https://www.alteryx.com/wp-content/uploads/snowflake-and-alteryx.jpeg
Source Node
Content Hash (SHA-256, erste 32 hex)
27653061300a1db76bec949657eae301
6 Best Tools to Replace Excel Macros — and When to Use Each
Image File
Original HTML

If your monthly reporting macro has been around for a while, it probably does more than one thing. Yours might import a folder of CSV files and standardize the product codes before refreshing the workbook. By the time it has formatted the output and emailed reviewers, one button is hiding an entire process. When that process becomes difficult to maintain or hand off, it’s natural to look for one alternative to Excel macros that can take over the whole job.

But even if one replacement sounds simpler, you probably don’t need a single tool to do all of it. The better path is to first separate the different kinds of work inside the macro, then choose the right automation layer for each. We’ll compare six options and look at how you can protect the business logic and workbook output along the way.

Start with the job your macro performs

There is no single best alternative to Excel macros because macros perform vastly different jobs. Start by matching each part of your current process to the tool designed for that specific kind of work:

Before you compare products, write down what starts the macro and which files or systems it touches. Note what it produces too, along with any manual exceptions that have accumulated around it. Don’t forget credentials or workbook objects such as charts and buttons. If the code loops through a range, ask what business rule the loop carries. “Apply the current product hierarchy to every transaction” will be much easier to rebuild and test than “replicate lines 420 through 517 of the VBA.”

Compare the best tools to replace Excel macros

Because these options fit different slices of macro work, the comparison isn’t a ranking. You may find that the right replacement combines two or more of them.

Power Query for repeatable data preparation in Excel

If your macro mainly imports files and handles data cleansing, start with Power Query. It can also reshape and aggregate the data before loading the result. Because it’s built into current Excel versions, another analyst can use the Applied Steps list to see how you transformed the data. You can refresh the query and still deliver the workbook your audience expects.

Take the monthly reporting example from the start of this article: Power Query could bring in the Excel and CSV files before standardizing the data types. It could then merge the product lookup and load the prepared result into a table.

What it handles less naturally are button clicks and workbook events. Precise formatting across an output sheet can also be a poor fit. Think of it as a data preparation tool rather than a general substitute for everything VBA can control.

Office Scripts for cloud-oriented workbook automation

If you want to stay within Microsoft 365, Office Scripts is the closest native option for many supported workbook tasks. You can record actions and edit the resulting TypeScript, then run the script in Excel for the web or the desktop app on Windows or Mac. For example, a script might refresh a table and update its ranges before preparing the output tab. It can adjust charts, too.

Even with that overlap, Office Scripts is more of a close fit rather than a drop-in replacement. Microsoft documents important differences between Office Scripts and VBA: VBA has broader desktop coverage, while Office Scripts is designed for cloud-based work across supported platforms. You also won’t have Excel-level events, and you’ll need to check the licensing and trigger requirements.

Power Automate for orchestration across Microsoft tools

If your macro reaches beyond the workbook, Power Automate can replace or coordinate some of its steps. It can respond to a schedule, move files between systems, and manage approvals or notifications. It can also call an Office Script. In the monthly workbook, for example, it could start the process when files arrive and notify reviewers after the finished report reaches its destination.

As you design the replacement, keep orchestration separate from the work happening inside the workbook. Data transformation is another job again. These steps may happen in sequence, but they have different operating requirements. If you use desktop-flow Excel actions, confirm that the right machine and credentials will be available. You’ll also need the appropriate unattended-run license and a plan for handling any on-screen prompts that interrupt the process.

Python for code-heavy analytical logic

Python may be your strongest option when the macro contains complex calculations or needs specialized libraries. It also makes sense when the transformations belong in an engineering-managed codebase. The pandas library can read Excel data, while openpyxl supports more direct workbook interaction. If your team already has the right testing and deployment practices, you can manage the logic alongside other code.

That flexibility helps only if someone can support it. The owner will need to manage the environment and its packages, as well as testing and deployment. They’ll also be responsible when a run fails.

You’ll need a separate test plan for workbook fidelity too; successfully reading and writing tabular data doesn’t mean the new file will preserve its formulas or formatting.

One other distinction matters here: Standalone Python automation isn’t the same as Python in Excel, which runs Python calculations within supported Excel environments. Python in Excel can extend the analysis in your workbook, but it won’t route files or automate the desktop.

RPA for desktop and legacy application steps

RPA (Robotic Process Automation) — software that emulates human interactions with digital systems — enters the picture when your workflow has to operate Excel alongside a legacy desktop application that doesn’t offer a dependable API or connector. An RPA platform can open the application and enter values through its controls. It can then move the result into the next step.

An unexpected dialog can break the run even when the business rule hasn’t changed. So can a renamed control or a timing change. Use interface automation only where you genuinely need the interface. When they’re available, direct data connections and APIs usually give you a more stable boundary for system-to-system work.

Alteryx One for analyst-owned multi-source workflows

Alteryx One is the right fit when a macro has outgrown the workbook and become a multi-source analytical workflow. As business rules expand across multiple files and systems, a visual platform gives colleagues a clearer way to inspect the analytical sequence.

To judge the fit, look at where the complexity sits. If the hard part is combining sources and maintaining business rules, moving the logic outside of a spreadsheet prevents bottlenecks. A workbook automation tool will probably fit better if the macro mainly responds to buttons or desktop events.

Even where the analytical work fits, Alteryx isn’t an automatic VBA converter. It won’t reproduce every desktop event or embedded workbook object, so you’ll still need to confirm the input and output behavior your file requires.

Know when to keep VBA or combine tools

After you map the work, you may find that part of the current macro should stay. A controlled, signed macro can still be the most sensible option when it depends on desktop events or COM. The same may be true for an Excel add-in or detailed workbook behavior that another tool can’t reproduce at a reasonable cost. Microsoft blocks macros from internet-sourced files by default, but it also supports governance through measures such as trusted publishers. So the decision isn’t “modern tool or unsafe macro.” It’s whether your current design can be secured and maintained by the people who support it.

Nor does replacing a macro mean replacing Excel. Your workbook can remain the working interface or final output while another tool handles the data transformation or orchestration behind it.

When no single tool covers the work cleanly, a hybrid design can work well as long as the boundaries are clear and someone owns each handoff. For the monthly workbook we’ve been following, Power Query or Alteryx could import the source files and standardize the product codes before applying the business rules. An Office Script could then refresh the tables and format the output tab. Power Automate would start the process and alert reviewers when the file is ready.

If one remaining step depends on a desktop event that those tools can’t reproduce, you could keep VBA for that narrow piece instead of rebuilding everything around it. But take a harder look if a modest process now needs several credentials and three support teams. More handoffs also create more failure points, so you may have traded one maintenance problem for another.

Evaluate who will operate the replacement

The greatest risk in replacing a macro is ignoring what happens after the build. Your team still has to run the process on a difficult reporting day, investigate bad outputs, and update the logic next quarter, meaning the tool must match the team’s operational capacity.

As you narrow the options, ask:

- Who can maintain the logic, and do they have the right level of technical expertise?

- Must it run unattended, and which credentials or machine resources will that require?

- Does the team need shared execution and permissions? How will you handle version history and monitoring, including any audit trail?

- Which workbook behaviors and formatting details must survive?

- What constraints come with the license and platform? How will you deploy the automation?

- How will the owner spot a run that finished successfully but produced an incomplete result?

Of all these questions, the last one is especially easy to miss because a green status looks reassuring. It tells you the automation finished; it doesn’t tell you that this month’s lookup file was complete or that a changed product code matched the right category.

Class (B2B/B2C)
B2B
Ingest Status
Rewritten
Dedupe hash
2ac24d6d2004cf293ae6c561a00fdce3
Press Eligible
Yes
Press Eligible Reason
Compares business automation tools for replacing Excel macros and explains their use cases.
Source Name
Alteryx, Inc.
Original Summary

If your monthly reporting macro has been around for a while, it probably does…

Image URL
https://www.alteryx.com/wp-content/uploads/adobestock_718140169-scaled-e1792001214410.jpeg
Source Node
Content Hash (SHA-256, erste 32 hex)
b73501c8e1198084f0bc127bc93b9b19
Measuring Employee Engagement and eNPS: A Practical Guide
Image File
Original HTML

An Employee Net Promoter Score (eNPS) of +15 often looks like a stable win on a leadership dashboard. Yet that exact same score can easily hide a shrinking pool of promoters, a growing block of detractors, and a plummeting response rate. A single net score might tell you whether employees will recommend the company, but it doesn’t explain why their experience changed or if they really feel connected to their work.

To turn candid feedback into a reliable baseline, HR and EX teams need to isolate response behaviors, standardize survey logic across cycles, and fiercely protect employee identities in free-text responses. Let’s look at how to build a repeatable measurement process that separates real workforce trends from statistical noise.

In this guide we’ll cover:

Why an overall score hides the actual employee experience

Grouping distinct workplace experiences into one giant “engagement” index is a bit like blending all your leftovers into a smoothie — you lose track of the actual ingredients. Workload, career development, and psychological safety are entirely different things. If you average them together, a severe drop in manager support can be completely masked by a temporary spike in happiness over the new bonus structure.

It helps to start by defining the exact state you’re measuring. If you adopt an established HR model for work engagement (typically focusing on vigor, dedication, and absorption), keep those components visible to the leaders reading the report. They need to know exactly what’s moving the needle.

More importantly, let’s lock down the question wording. If Q1 asks about “immediate manager support” and Q2 asks about “confidence in leadership,” any variance between them is a change in the survey, not a trend in engagement. It’s a good practice to keep a strict record of response scales and flag any comparison that relies on altered questions.

Why the same eNPS report fails different stakeholders

When HR analysts distribute the quarterly engagement results, the data is immediately pulled in three different directions. The CHRO, the frontline manager, and Information Security all look at the exact same dashboard but need entirely different answers. If your measurement strategy doesn’t account for these conflicting needs, the report fails all of them.

Executive leadership needs high-level trend fidelity. They’re looking for systemic shifts in advocacy and retention risks across entire business units. If a reorganization happened mid-quarter, they need to know that the historical comparison they’re looking at is really an apples-to-apples baseline.

Frontline managers, on the other hand, need localized, actionable data. Telling a regional director that “global dedication is down 4%” gives them nothing to work with on Monday morning. They need to know if their specific team is struggling with workload or missing career development opportunities — without violating the anonymity of their direct reports.

Meanwhile, Information Security and Data Privacy teams are looking at the legal and ethical footprint of the data. They need a verifiable audit trail showing exactly who has access to raw survey text. If managers can filter a dashboard down to a three-person demographic group and read their unredacted complaints, the reporting process becomes a massive liability.

The math that makes eNPS misleading in isolation

eNPS has a funny way of obscuring the extremes of your workforce by burying the passive majority. Because eNPS is calculated by subtracting the detractor percentage (scores 0–6) from the promoter percentage (scores 9–10), entirely different workforce vibes can produce the exact same score.

Think about it: 45 promoters and 30 detractors yields an eNPS of +15. But 30 promoters and 15 detractors also yields a +15, even though the second group has significantly more passive employees.

You’ll always want to present the final score alongside the full distribution of promoters, passives, and detractors. It’s also crucial to report the response rate; a high score drawn from a 20% participation rate is a red flag, not a mandate. Advocacy is a valuable metric, but someone might happily recommend the employer for its pay while feeling entirely disconnected from their daily role.

Where blended feedback creates false trends

It’s tempting to combine annual census surveys, short pulse checks, and exit interviews into one massive data set. But treating them like a single source of truth distorts your findings, because the populations and collection conditions are fundamentally different. Let’s be honest: a departing employee speaks with a very different filter than a newly hired analyst.

Treating each feedback channel as a distinct signal rather than a cumulative database keeps your insights clean. As highlighted in Alteryx HR analytics solutions, the pressure HR teams face to defend programs with clean data means you can’t afford to mix conflicting context:

Exit interviews are fantastic for revealing recurring departure drivers, like unclear advancement paths, which can help you refine the questions on your next current-employee pulse. However, you really can’t append exit-interview complaint percentages directly to pulse-survey results. If you fold performance management data into the mix, it’s best to limit the fields to aggregate role or tenure metrics.

The privacy gap in open-text feedback

Psychological safety dictates data quality. If employees think their candid answers will expose them, they’ll self-censor — it’s that simple. Forbes cites research from Leadership IQ’s 2025 Team Effectiveness Study, which found that only 18% of employees feel completely safe voicing an unpopular idea. This reminds us that providing a channel to speak is useless without ironclad protection.

It helps to clearly distinguish between anonymous surveys (no identity link) and confidential surveys (controlled links with restricted access) for your teams. Never promise anonymity if unique URL tokens or HR system joins can trace a response back to a specific person.

Open-text comments are especially tricky. Just stripping out a name isn’t enough when an unusual role, a specific incident, or a combination of demographic filters can instantly out someone. Applying modern 2026 enterprise data anonymization protocols to review and redact text before quoting it in leadership reports goes a long way. Finally, suppressing reporting for demographic groups smaller than 10 respondents prevents managers from inferring identities.

How to mine sentiment at scale without breaking trust

Reading thousands of free-text comments manually isn’t just an administrative bottleneck — it’s a massive privacy liability. As we discussed, a human reading unredacted comments can easily piece together identities based on specific project mentions or unique writing styles.

Modern HR teams solve this by using natural language processing (NLP) and text mining to automatically categorize feedback. Instead of passing raw spreadsheets to managers, algorithms group comments into themes like “compensation,” “workload,” or “career growth.”

From there, sentiment analysis assigns a positive, neutral, or negative score to those themes. This allows leadership to see that “return to office” is a trending topic with a severely negative sentiment score across the Engineering department, all without a single manager ever reading an identifiable complaint.

The breaking point: When organizational changes corrupt the trend

The most dangerous errors in employee engagement reporting don’t happen because the math is wrong. They happen because the organization changed shape, but the reporting workflow didn’t.

Consider a mid-sized enterprise that recently reorganized its European operations. Historically, the engagement survey tracked two distinct territories: “Nordics” and “Southern Europe.” Halfway through the year, the HRIS team updates the backend systems to reflect the new cost centers: “EMEA-N” and “EMEA-S.”

When the HR analyst exports the Q3 survey results and attempts to join them to the historical baseline in a spreadsheet, the VLOOKUP fails. The old names don’t match the new names. Hundreds of historical responses silently drop out of the data set. Suddenly, the regional director receives a report showing a 12-point plunge in engagement, triggering a massive panic over a phantom retention crisis.

To fix it, the analyst usually has to spend four days manually mapping cost center codes in Excel, desperately trying to reconstruct a baseline that the business can trust. This manual rebuild tax is a reality for HR teams everywhere — because their reporting logic is built around fixed assumptions that the data no longer meets.

How to standardize pulse data for repeatable analysis

Reliable engagement reporting means locking down definitions, untangling messy HR data, and holding your comparison logic totally static across cycles. As that scenario proves, a basic spreadsheet join drops hundreds of responses and silently corrupts your trend the moment a department changes its name.

Building a measurement dictionary to record your eNPS classification rules, composite score logic, and valid-answer minimums is a lifesaver here. When engaging in data blending to combine files, standardize dates, region names, and missing-answer codes before you calculate a single average. It’s a good idea to document response rates and run nonresponse bias checks, as recommended by the U.S. Office of Personnel Management.

This level of consistency requires your data prep logic to live in a transparent, repeatable system — not in an analyst’s head while they try to perfectly execute a dozen formulas every quarter. That means the logic has to live in the tool, not the person — which is exactly what platforms like Alteryx One Designer are built to do.

Class (B2B/B2C)
B2B
Ingest Status
Rewritten
Dedupe hash
bee4938476c54caf5aa62a6cf1b0046d
Press Eligible
Yes
Press Eligible Reason
Manuelle Prüfung nötig. Risiko: MEDIUM. Flags: ['numbers']. Stichprobe: False
Source Name
Alteryx, Inc.
Original Summary

An Employee Net Promoter Score (eNPS) of +15 often looks like a stable win…

Image URL
https://www.alteryx.com/wp-content/uploads/adobestock_613505886-scaled-e1792001921571.jpeg
Source Node
Content Hash (SHA-256, erste 32 hex)
62d729fcae576b62debfa0c1e84e9f8d
The Best Excel Alternative for Data Analysis Depends on One Thing
Image File
Original HTML

When comparing Excel and other alternatives, there is truly one question to ask: is the work in front of you a one-time calculation, or a process someone will repeat next month, next quarter, and the quarter after that?

That single distinction — one-time or recurring — is the one thing this decision depends on, including whether an Excel alternative is worth evaluating at all.

The row-limit argument is a distraction from the real ceiling

Technically capable of holding more than a million rows per sheet, Excel almost never hits that wall. What breaks first is repeatability, not capacity.

Every time source data changes shape (a renamed column, a new region added mid-quarter, an extra week tacked onto a date range), the manual process gets rebuilt from memory instead of simply re-run. Nothing about the original build anticipated what would need to change, so each cycle starts over rather than picking up where the last one left off.

Because nothing about the format catches a mistake, spreadsheets carry no built-in error control. Industry studies have found that 90% of spreadsheets with more than 150 rows contain at least one major mistake. Those errors are structurally hard to catch mid-process, a property of the format rather than a reflection of analyst skill.

That same distinction is what separates what Excel does well from where it runs out of road. Ad hoc analysis, a single question against a single data set, is Excel’s home turf, and no workflow tool needs to replace that. The ceiling shows up specifically in recurring, multi-source work, where the real expense comes from rebuilding the process every cycle — under the radar, by whoever still remembers how — not from building the first version.

The cost of an undocumented spreadsheet process

Beyond Excel, the same pattern plays out anywhere data goes ungoverned and hand-maintained, and poor data quality is the result. Gartner estimates it costs organizations an average of $12.9 million a year, mostly because of inconsistent logic scattered across sources with no shared record of how it works. Excel didn’t cause that pattern. It’s just the tool most likely to be holding it when someone finally notices.

A spreadsheet crosses a specific line the moment it requires “check with [name] before changing this.” That’s the point it stopped being a spreadsheet and became undocumented infrastructure that happens to open in Excel.

If your team’s honest answer to “how does this report actually get built” is a person’s name instead of a process, you already have your answer.

What a recurring, multi-source process actually requires

Moving from one-off to recurring changes four things a single-use spreadsheet never had to answer for:

- Consolidation: Can new files or sources get added without re-typing formulas or rebuilding ranges by hand?

- Repeatability: Can the same steps re-run against new data without anyone rebuilding the logic from scratch?

- Error handling: Are mistakes caught before they reach the output, not discovered after a manager asks why the numbers don’t add up?

- Auditability: Can someone other than the original builder open the process and understand what happened to the data along the way?

Excel’s Power Query adds a layer of repeatability, but multi-file consolidation and error-checking still tend to rely on manual VLOOKUP or INDEX-MATCH chains that break in the background the moment a source schema shifts underneath them. The formula still runs. It just returns the wrong answer, which is how point automation works: each piece runs on its own, but someone still reconciles the pieces by hand.

Your manager or your IT team wants proof that the process is repeatable and someone besides you can audit it, not a verdict on whether Excel is good or bad.

Your IT team usually cares about three specific things when it comes to reviewing new tooling:

- Where does the data live during processing?

- Who besides the person who built it can see the transformation logic?

- What happens if the person who built this leaves the team next quarter?

A spreadsheet answers none of these three questions well, not because Excel is poorly made, but because the format was never built to hold those answers.

Manual Excel vs. custom scripting vs. a workflow-based Excel alternative

Scored against our four criteria of consolidation, repeatability, error handling, and auditability, three approaches to recurring, multi-source work land in different places, and none of them wins across the board.

Manual Excel comes in lowest on repeatability and auditability, because the logic lives only in formulas the original builder can trace. Custom scripting fixes consolidation and repeatability well enough, as long as someone on the team can write and maintain Python or VBA, but auditability still stays low for anyone who isn’t that person.

A code-free, workflow-based platform such as Alteryx One handles the first three columns directly. You build the process once, save it as a reusable workflow structure, and point it at whatever files show up next time — no retyping from scratch. When a schema doesn’t match, you decide what happens next instead of finding out from a wrong number downstream. It’s the same data preparation work a spreadsheet asks a person to redo by hand every cycle. You just do it once.

The decision rule

If your process touches multiple files or sources and you’ll run it again, a workflow-based approach wins on the stuff that matters most for recurring work. If it’s genuinely one-time, stick with Excel — that doesn’t change. For a closer look at how the platform maps to habits you already have in Excel, the Alteryx guide for Excel users walks through it step by step.

Custom scripting isn’t a lesser option so much as a differently staffed one. If you have an in-house Python developer, you can build something that consolidates and repeats reliably, and often will. The tradeoff surfaces downstream because you own the business logic, but you’re not the person who can read the script that encodes it. Every change will still route back through whoever wrote the original code.

A real-world example: consolidating a month-end expense report

Say you’re the finance analyst at a mid-size company who aggregates expense data from five department spreadsheets every month to support budget tracking. Each department exports its own file, and the column order is never quite identical between them. Most months, at least one department renames a column or adds a new expense category without telling anyone.

In the manual-Excel version, you open each file, copy rows into a master sheet, and re-check the VLOOKUP ranges because a department got added or dropped this quarter. One department reports figures in whole dollars while another includes cents, and that mismatch throws off a subtotal with no warning until you notice the total looks off by a little and start backtracking through five files to find why.

In the workflow-based version, built in Alteryx One, none of that happens by hand. An Input Data tool pulls every department file from the shared folder by wildcard, so a slightly different filename doesn’t stop the run. When a department renames or adds a column, a union tool catches it — matching by column name instead of position means the mismatch gets flagged instead of landing unnoticed in the wrong place.

And the whole-dollars-versus-cents problem that used to mean a manual find-and-replace across five separate files gets fixed once, by a data cleansing tool, across all of them at the same time.

Governance and consistency you can prove

The workflow-based version saves real time, but the bigger outcome is that you can now show a manager, or an auditor, exactly which step transformed which field. That’s a governance answer a static spreadsheet output can’t give, no matter how carefully it was built the first time.

Consistency matters here too, especially for finance. The same workflow runs every month, so this month’s report and last month’s were built exactly the same way. A variance between them means spending changed, not that someone cleaned the data differently this time. That distinction stays invisible until an auditor asks about it, and then it’s the whole conversation.

For a broader look at consolidating and cleaning data before analysis, the Data Preparation for Dummies e-book covers the same ground in more depth.

Where Excel is still the better call

None of this makes Excel obsolete. A few situations still belong squarely to Excel:

- A true one-time analysis, never meant to run again

- A small data set pulled from a single source

- Quick exploratory work before a process is even defined

Building a workflow around something that will never be repeated just adds overhead with no return.

That same logic extends to comparing Excel against Google Sheets, a common enough question in its own right. Both are spreadsheet programs first, built around cells and formulas rather than saved, reusable process steps. Choosing between them comes down to collaboration and licensing, not which one handles recurring work better. Neither one does. Google Sheets hits the same repeatability wall Excel does, at roughly the same point.

If you already have a data engineer maintaining Python or dbt pipelines, you likely don’t need a new platform layer at all. Consolidation, repeatability, error handling, and auditability still apply — none of the three columns in that table wins across every situation, just the one that fits yours.

What a workflow-based approach doesn’t solve

A workflow-based approach still needs someone to build and maintain the process. What it removes is the burden of rebuilding a report every cycle, not the work of designing it correctly the first time.

That kind of honesty makes a better internal case than pretending the old tool is worthless. Whoever signs off wants a clear picture of what helps and what doesn’t, not a sales pitch that claims there’s no tradeoff at all.

Class (B2B/B2C)
B2B
Ingest Status
Rewritten
Dedupe hash
d7a39403000e1d92f60988b799496c5f
Press Eligible
Yes
Press Eligible Reason
Manuelle Prüfung nötig. Risiko: MEDIUM. Flags: ['finance', 'numbers']. Stichprobe: False
Source Name
Alteryx, Inc.
Original Summary

When comparing Excel and other alternatives, there is truly one question to ask: is…

Image URL
https://www.alteryx.com/wp-content/uploads/adobestock_722374031-scaled-e1792002860944.jpeg
Source Node
Content Hash (SHA-256, erste 32 hex)
e95c0bb62c97526c725b40ed087d1491
Stop Burning AI Budgets on Deterministic Work
Image File
Original HTML

Enterprises are discovering an uncomfortable truth about generative AI: a lot of the token budget going into “agentic” workflows is being spent on tasks that were never a good fit for an LLM in the first place. Comparing files, reconciling numbers, checking balances — this is deterministic work, and asking a stochastic model to do it burns tokens, adds cost, and introduces risk that shouldn’t exist for tasks that already have a right answer.

NextWave, a digital acceleration consultancy for financial services and an Alteryx partner, set out to test that theory directly — and the results are now shaping how both companies talk about responsible, cost-controlled enterprise AI.

When Alteryx handles the deterministic work first, such as comparing, reconciling, and validating data, organizations can reduce the cost of paying a model to redo work that already has a right answer. In our verified benchmark testing with NextWave, that approach cut token consumption by up to 95% (a 20x reduction) on a defined reconciliation workload. Here is how the test worked.

The Test: Office of the CFO reconciliation

NextWave bench-tested a common Product Control workload: a daily front-office-to-back-office reconciliation, validating consistent views of open trades, valuations, risk, and cash balances across a data set of 120 trades, then explaining any differences with suggested next-best steps.

They ran the task two ways.

The first approach was purely stochastic: hand an LLM the front-office and back-office files directly and ask it to compare trades, valuations, risk, and cash balances, flag differences, and suggest next steps.

The second approach used an Alteryx One workflow, published for the LLM to call using the Model Context Protocol (MCP). Instead of asking the LLM to do the comparison itself, the query asked it to execute the Front Office Back Office Data Reconciliation workflow on Alteryx One — letting Alteryx handle the comparison logic deterministically, with explainability and audit built into the workflow execution, while the LLM stayed focused on what it’s actually good at: interpreting the output and recommending next steps.

The results

The gap between the two approaches was stark:

- 20x fewer tokens consumed by the Alteryx One + LLM workflow versus the purely stochastic approach

- 100% accuracy on the reconciliation, versus 2 missed breaks out of 120 trades when the LLM worked unaided

- Enterprise-grade governance, explainability, and auditability built into the deterministic workflow layer — something a pure LLM comparison can’t guarantee

LLMs are a fantastic step forward in technology, but care needs to be taken in knowing when to use them and when not to. It’s about knowing what tool to use for what problem and having those tools in your tool bag.”

It’s best to let deterministic workflows do the work they’re designed for, and let LLMs focus on reasoning, summarisation and next best actions. This is how enterprises can scale AI while controlling GenAI costs and improving trust.

To see how deterministic logic enables cost-effective, accurate AI responses, we encourage you to explore the Month End Close Acceleration AI-Ready Starter Kit.

Why this matters beyond one reconciliation task

This isn’t an isolated result. Alteryx’s own internal testing, published alongside its recent AI capability launches (Ask Alteryx, Agent Studio, an MCP Server, and Alteryx Skills), found similar patterns at scale: up to 93% token reduction and an 85% speed increase on tasks involving raw, ungrounded data, and up to 83% token cost reduction with a 65% speed increase on tasks using clean, already-governed data.

The common thread is what Alteryx calls the VURA framework — making business logic visible, understandable, repeatable, and auditable — so that AI agents draw on governed, deterministic logic instead of re-deriving it stochastically every time. NextWave’s reconciliation test is a concrete, numbers-backed example of that principle in production, not just in theory.

The bigger lesson

As more enterprises move agentic AI from pilot projects into production, the cost and accuracy of “let the LLM figure it out” approaches will become harder to ignore. The work of NextWave and Alteryx points to a more sustainable pattern: use deterministic, governed workflows for the deterministic parts of a process, and reserve the LLM for reasoning, summarization, and recommending what to do next.

NextWave and Alteryx are actively helping financial services clients apply this pattern — using LLMs alongside the Alteryx One platform to solve reconciliation and other Office of the CFO problems, and using LLMs to accelerate adoption of the Alteryx One platform itself.

Class (B2B/B2C)
B2B
Ingest Status
Rewritten
Dedupe hash
1469e451941e659201824c62e9adbc60
Press Eligible
Yes
Press Eligible Reason
Manuelle Prüfung nötig. Risiko: MEDIUM. Flags: ['numbers']. Stichprobe: False
Source Name
Alteryx, Inc.
Original Summary

Enterprises are discovering an uncomfortable truth about generative AI: a lot of the token…

Image URL
https://www.alteryx.com/wp-content/uploads/ai-costs-blog.jpeg
Source Node
Content Hash (SHA-256, erste 32 hex)
f7c10ecdd3d46ae4f2fc78408c175e9f
The Fix for Manual Spreadsheets Isn’t a Tool — It’s Data Workflow Automation
Image File
Original HTML

If your team is dealing with a slow, error-prone spreadsheet process, you’ve probably reached for the same fix — a better tool, a smarter dashboard, something to replace the spreadsheet. But that’s actually the wrong layer to work on. The steps that turn a raw export into a finished report were never written down anywhere reusable. They’re embedded in formulas, buried in tab names, and carried around as habits nobody’s ever had to explain out loud.

That’s why the process still runs correctly every week. One person remembers exactly which columns to rename, which tab to paste into, which formula to re-drag down another 40 rows. None of that logic exists anywhere except in their head, which means the process is one vacation or one resignation away from breaking.

Data workflow automation means something more specific than “make the spreadsheet smarter.” It means capturing those steps once, in a form other people can read, and letting them run on a schedule or trigger instead of waiting for someone to open a file and flip the switch. The tool comes after that decision, not before it. Capturing the logic is the actual work.

This article walks through how that conversion happens. What to inventory before you touch anything, and where the logic gets captured, come first. Then what “automated” requires beyond a correct process, where this commonly goes wrong, and how to start with one process instead of trying to convert everything simultaneously.

The process is fine. The dependency on one person isn’t.

A manual spreadsheet process rarely fails because the logic is wrong. It fails because the logic is fragile in ways that show up only under pressure: a renamed column breaks a formula that referenced it by position, a data set grows past a row limit nobody planned for, two people edit the same file and one set of changes disappears without anyone noticing. None of these are edge cases. They’re the normal cost of running a process that only exists in one file and one person’s memory.

The institutional-knowledge problem is the bigger one. When the analyst who built the process changes teams, gets promoted, or leaves, whoever takes over next doesn’t usually inherit the knowledge of how it actually works. Someone else has to open the file, reverse-engineer what each tab does, and guess at the parts that were never documented because they didn’t feel like decisions at the time. That reconstruction work is the real cost, and it usually lands at the worst possible moment, right when the report is due — and the one person who understood it is unreachable.

This isn’t a temporary workaround you’ll eventually outgrow. Gartner’s tracking the same shift, expecting citizen development to go mainstream within a couple of years. Analysts assembling their own repeatable processes isn’t a stopgap solution. It’s becoming the default way this work gets done, which raises the stakes on doing the conversion well rather than just doing it fast.

Map the process you’re really running

Before converting anything, write down every step between “raw file lands” and “finished output goes out,” including the ones that feel too small to count:

- Every rename

- Every filter

- Every paste between tabs

- Every formula

- Every formatting pass before the email goes out

Those small steps are usually the ones that break first because nobody thinks of them as steps.

Most people underestimate this list by half. Habitual steps stop registering as steps after you’ve done them fifty times, so the honest inventory takes longer than expected and turns up more manual touchpoints than anyone remembers agreeing to. Write the list down somewhere you’ll actually look at it again. That’s the point of the exercise.

Here’s what that inventory looks like for an operations analyst who consolidates inventory data every Monday. Three regional warehouses each export a stock report, and the analyst combines them into one tracking sheet, checking current levels against reorder thresholds before the week’s replenishment orders go out.

Two things break it almost every month:

- One warehouse’s export lists unit of measure as “EA” for each; a second regional system exports the same field as the full word “Each.” The mismatch breaks a lookup formula, and the analyst has learned to just re-check the totals by hand rather than fix the underlying cause.

- A third file occasionally arrives with an extra blank row at the top from a system export glitch, which shifts every downstream formula reference by one row until someone notices the totals look wrong.

Take a minute with your own version of this list. Does it run through one person, one file, and a handful of judgment calls nobody’s ever written down? If so, you’re looking at the same shape of problem the rest of this article addresses.

Data workflow automation begins with capturing the logic once

Capturing the logic means turning a formula buried in cell F12, which only the original analyst fully understands, into a named, visible step anyone on the team can open and read. Rename becomes a rename step. Filter becomes a filter step. Join becomes a join step. Each one stands on its own instead of being buried inside a chain of cell references nobody else can fathom.

Applied to the inventory scenario, the fix for the unit-of-measure mismatch stops being a manual double-check the analyst runs on the side every month. It becomes a documented standardization step where “EA” and “Each” map to the same value, visibly, before the data ever reaches the reorder-threshold comparison. The blank-row problem becomes a validation step that checks the shape of each incoming file before anything downstream runs. Anyone reviewing the workflow can see exactly what happened to that data and why.

That visibility is the governance win, not just the speed one. A workflow that shows its steps means someone besides the original analyst can verify what ran, spot where a change would ripple, and catch a mistake before it reaches a report rather than after. Alteryx One’s guide for Excel users maps this kind of standardization task, and others like it, to a code-free equivalent inside a governed, repeatable environment.

Remove the “someone has to press go” step

Capturing the logic isn’t automation by itself. A workflow that runs correctly every time someone manually opens it is still a manual step. It’s just a faster one. Automation means the process runs on a defined schedule or in response to an event, with nobody required to start it.

After the inventory workflow’s logic is captured, that same consolidation can run on its own every Monday morning before the analyst even opens a laptop. Scheduled execution within Alteryx One lets a captured workflow run on a defined cadence without anyone initiating it, and event-based triggers extend that further, running a workflow when a new file lands rather than waiting on a fixed clock.

But event triggers have real limitations. They typically watch for an exact file path rather than an entire folder, and they don’t always distinguish a file being newly created from one that’s simply been updated. Test trigger behavior against your actual file-naming patterns before relying on it for anything time-sensitive.

This is what data pipeline automation looks like at a slightly larger scale — not a single workflow run once, but a recurring, scheduled process. The same distinction between “runs correctly” and “runs itself” is the one that separates scheduling from true automation at that level too. A process someone still has to remember to trigger by hand hasn’t crossed that line yet, no matter how clean the underlying logic is.

Where the spreadsheet conversion commonly breaks

Three failure modes show up most often:

- Automating the run, not the logic. Replacing one opaque spreadsheet with an equally opaque workflow, built in whatever platform was easiest to adopt, without capturing the logic in a form anyone besides the builder can read. You end up automating the running of a process without solving the knowledge-transfer problem that made the original spreadsheet fragile in the first place.

- Automating the processing, not the retrieval. A tool whose only real connection to a source system is watching a folder for a file someone exported manually. The analyst still logs into three systems, exports three files, and drops them in the right folder by hand every Monday. The processing step gets faster; the most time-consuming manual work never changes.

- Splitting data and document automation. Treating document workflow automation as a separate category from data automation, with one tool routing the spreadsheet and a different one routing the PDF or report that comes out of it. That split usually means the handoff between the two is still manual.

Whether you call it business process automation, task automation, or workflow automation software, the underlying question is the same: can someone other than the person who built it understand what it does? And before adopting anything, ask whether the platform connects directly to the source system and pulls current data on each run, or whether it just waits on a person to hand it a file.

If you want a deeper gut-check on whether your team has actually outgrown its current setup, this self-diagnostic on scaling past spreadsheet-based analysis walks through the signals worth watching for. And for a longer look at what turns analyst-built logic into something genuinely repeatable rather than just faster, this blog on automating data workflows without writing code is worth the 10-minute read.

What the finished process looks like

The Monday inventory consolidation that used to take 90 minutes of manual cleanup and cross-checking now runs unattended overnight. The unit-of-measure standardization that used to live only in the analyst’s memory is a visible, documented step in the workflow, not a manual workaround someone has to keep track of.

Class (B2B/B2C)
B2B
Ingest Status
Rewritten
Dedupe hash
f2b838123dc39d9d949a190e276ebcc2
Press Eligible
Yes
Press Eligible Reason
Business-focused guidance on automating spreadsheet data workflows, with an Alteryx product reference.
Source Name
Alteryx, Inc.
Original Summary

If your team is dealing with a slow, error-prone spreadsheet process, you’ve probably reached…

Image URL
https://www.alteryx.com/wp-content/uploads/adobestock_722370823-scaled-e1792005486885.jpeg
Source Node
Content Hash (SHA-256, erste 32 hex)
4c5f0b28281bf44f86e9ac6832e16bee
The Finance Skill AI is Making More Valuable
Image File
Original HTML

Every team in the business is being told to use AI, and most are happy to. Finance professionals are often the ones saying “not for this, not yet.” In a lot of meetings, that makes them look like the obstacle.

If you work in finance, that hesitation is expertise. You know that revenue in the board deck excludes the two entities still on the legacy ERP, and that your biggest logistics vendor’s accrual gets trued up every March because their invoices run a quarter behind. AI knows neither, and it will answer confidently anyway. That knowledge lives in your head, a few macros, and a spreadsheet tab named “Do Not Touch.”

So when someone asks, “Why can’t we just use AI for this?” the person who looks like the bottleneck is holding the best answer in the room. The skill behind that answer is the one AI just made more valuable, and it belongs to the people many expected AI to replace.

AI closed one gap and opened another

For years, the case for finance automation tools came down to ease of use. Easier than writing code. More governable than another 40-tab workbook. AI is erasing that advantage fast, because anyone can now type a question in plain English and get something that looks like analysis.

What AI widened is the auditability gap. Large language models are built to produce a fluent answer every time, including when they’ve run out of real basis for one. Ask a first question and the answer may be close. Ask whether it still holds without the West region, or whether it matches what Finance reported, and the answers arrive with the same confidence. From the outside, there’s no way to tell when the fifth follow-up quietly drifted from anything real.

In most of the business, a plausible answer is useful. In finance it’s a liability, because someone has to sign it. The question for a finance team was never whether a tool could produce the number. It’s whether anyone can defend it when the auditor asks where it came from.

Will AI replace finance jobs? Look at what’s actually happening

The fear when generative AI arrived was simple: it would automate finance work, and finance people along with it. The numbers so far tell a different story.

According to McKinsey’s State of AI 2026, 14% of organizations using AI say it reduced their total workforce in the past year, less than half the 32% that expected reductions a year earlier. Two-thirds report little or no AI-related change in employment. Inside finance, Deloitte found that 84% of finance organizations have yet to redesign jobs or the nature of work around AI.

Put those together and the picture is clear. AI is landing on finance teams that look much like they did before, doing work that hasn’t been rebuilt around it yet. Someone has to decide how it gets rebuilt, and the strongest candidate is the person who knows how the business actually runs. That person is also getting harder to replace: the US Bureau of Labor Statistics projects employment of accountants and auditors to grow 5% from 2025 to 2035, with about 115,300 openings a year, many of them replacing experienced people who move on or retire.

What that person brings to the rebuild is the one thing AI can’t supply for itself: someone who owns the answer.

What owning the answer looks like

Owning the answer means building the conditions that make AI output trustworthy before anyone asks a question. In practice, four things have to be true.

- The data is governed before AI sees it. ERP and spreadsheet data get reconciled before any tool touches it, so every AI assistant and report draws from the same governed source.

- The logic is visible. The rule behind an answer, such as how intercompany eliminations are handled or which accounts count as active, sits where anyone can open it up and inspect it.

- Every number traces back. Any figure can be followed to the data and the rule that produced it. Ask the same question twice and you get the same answer.

- The cost is predictable. Heavy calculation runs once in a governed workflow instead of an AI model re-reasoning it from scratch on every question. Because the workflow already exists, each new AI assistant that shows up reuses it.

This is the work Alteryx is built for. Finance professionals encode the rules they already know as governed workflows, without writing code, so the AI tools the business uses draw on that logic directly. The AI still produces the answer. You’re the reason it holds up.

What you get back, and what your CFO sees

The first payoff is personal. AI was supposed to save you time, and for a lot of teams it has mostly moved the time around: less drafting and a lot more double-checking. When the logic is built once and governed, the re-checking stops. Next month’s question gets this month’s rigor without you redoing the work.

The second payoff lands one floor up. Finance leaders are watching AI costs climb in every function, and those costs land on finance to forecast and defend. Logic that runs once in a workflow is cheaper than logic an AI model reasons through on every question, and the same mechanism that makes it cheaper makes it reliably right.

Every workflow you build is also evidence your leader can point to: institutional knowledge that no longer depends on one person remembering it. Crowe, for example, has trained more than 190 tax professionals to build their own workflows, and more than 100 of them now run in production. That’s a team that got more valuable as AI arrived.

A better answer to “Why can’t we just use AI?”

Next time someone asks the question, you have an answer that works for everyone in the room. We can use AI. We’ll be able to trust it because finance owns the logic behind it, and you know how to build that logic.

AI can produce the answer. The professional who knows how the business runs makes it an answer the business can stand behind.

Class (B2B/B2C)
B2B
Ingest Status
Rewritten
Dedupe hash
06062664bb9cedc71d04979cae7c7d8e
Press Eligible
Yes
Press Eligible Reason
Manuelle Prüfung nötig. Risiko: MEDIUM. Flags: ['numbers']. Stichprobe: False
Source Name
Alteryx, Inc.
Original Summary

Every team in the business is being told to use AI, and most are…

Image URL
https://www.alteryx.com/wp-content/uploads/finance-ai-skills.jpeg
Source Node
Content Hash (SHA-256, erste 32 hex)
baf7dfbc83a7afb98e9f394090a69cbc
The Trust Equation: Why AI Needs Both Governance and Freedom
Image File
Original HTML

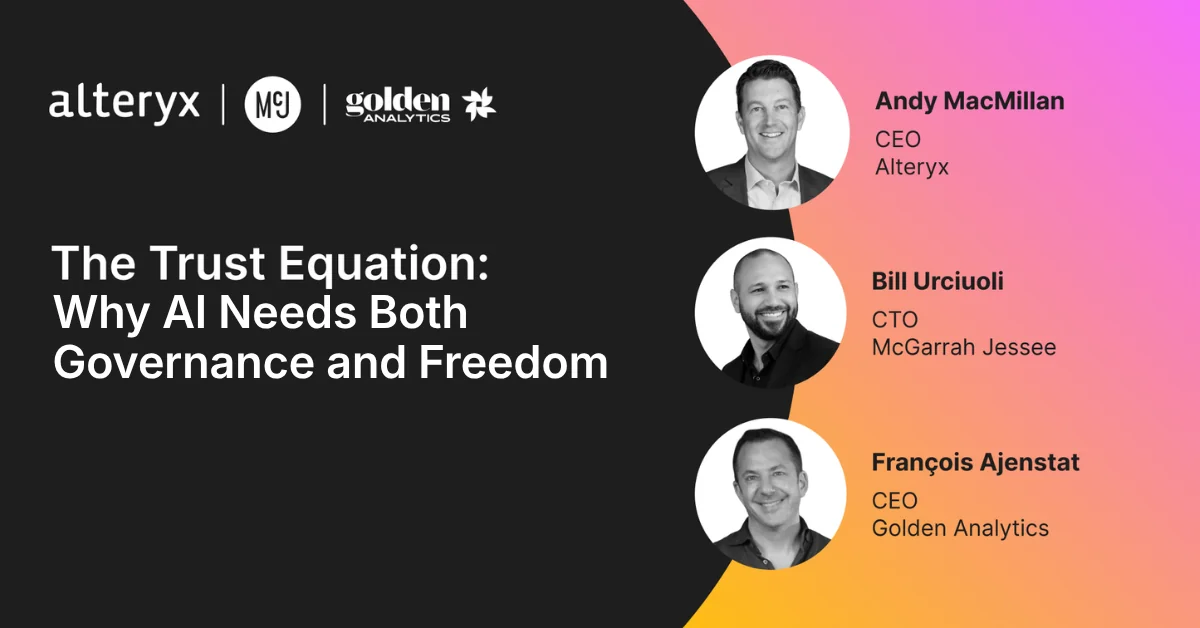
An Executive Panel with Andy MacMillan, François Ajenstat, and Bill Urciuoli

AI is making it easier than ever to get answers from data. But making answers easier to generate doesn’t automatically make them trustworthy.

As enterprise AI adoption continues to accelerate, the initial wave of unbridled optimism is giving way to a critical realization: speed without trust is an operational risk. When generative AI answers complex business questions, how can leaders ensure those outputs are grounded in reliable logic and verified data?

The next generation of analytics requires two things that have historically been difficult to combine: the confidence that comes from governed, trusted data and the freedom to explore without technical barriers.

Alteryx provides the governed workflows, calculations, and business logic. Golden Analytics makes it dramatically easier for people to explore that foundation, ask questions, and discover insights.

Trust + exploration. Governance + agency.

To explore this tension, three industry leaders sat down for an unscripted fireside conversation:

- Andy MacMillan, CEO of Alteryx

- François Ajenstat, CEO of Golden Analytics

- Bill Urciuoli, CTO of McGarrah Jessee (McJ)

Below is an edited transcript of their discussion on navigating Gartner’s trough of disillusionment, elevating the role of the analyst, and establishing guardrails for autonomous execution.

Grounded data vs. hype: navigating the AI trough of disillusionment

The AI landscape is shifting from pure excitement toward real-world scrutiny. How do we move past plausible-sounding AI outputs to verifiable, enterprise-grade trust?

François Ajenstat: The industry is passing through the classic Gartner trough of disillusionment around semantic models and ungrounded AI. There was a widespread belief that simply placing a semantic layer on top of raw data would magically solve enterprise analytics. Semantic models are an important foundation for trusted analytics. They provide consistent definitions and business context. But a semantic model alone doesn’t solve the problem of making analytics accessible.

You still need to make it easy for people to ask questions, explore the data, and understand the results.

Trust is essential. But trust without usability doesn’t create business value.

The dashboard has traditionally been the end product of analytics, but in an AI-native world, it becomes the beginning of a conversation. To earn trust, AI outputs must connect directly to the business logic and governed workflows organizations already rely on.

Andy MacMillan: If your AI is recalculating your revenue rules or logic every time a user asks a question, you don’t have an AI strategy—you have an operational risk. At Alteryx, we address this through our VURA framework:

- Visible: The underlying logic and workflows cannot remain a black box.

- Understandable: Business users and analysts must be able to comprehend how calculations are derived.

- Repeatable: Identical inputs must yield consistent, standardized outputs across the organization.

- Auditable: Full traceability must exist from the final answer back to the original source data.

Once AI produces a clearly wrong or unverified answer, user trust erodes almost instantly for future interactions. Grounding generative outputs in structured, repeatable workflows is the only way to solve that trust equation.

Bill Urciuoli: From the practitioner seat, trust isn’t earned inside a software demonstration—it is earned operationally inside the company. At McJ, true adoption moved when stakeholders could trace exactly where a number came from and feel empowered to adjust the business question themselves. Earning trust required showing people the lineage and changing how our teams work together, rather than just swapping out tools.

The future of the analyst: from ticket processors to strategic builders

As AI automates routine reporting and data manipulation, what happens to the human analyst? Are we augmenting their work or replacing it?

Bill Urciuoli: The honest version of our transformation story is that the analyst’s job shifted from building reports to owning questions. Historically, analysts spent their days processing Jira tickets, pulling standard queries, and delivering static report builds.

When you introduce AI-native analytics grounded in a solid data foundation, analysts stop spending time on manual report creation. They shift toward interrogating business problems before they emerge, acting as strategic advisors who guide leadership on what questions to ask next.

François Ajenstat: AI doesn’t eliminate the analyst. It amplifies their impact.

For years, analysts have been buried in requests to build reports, modify dashboards, and answer questions that should be easy to answer.

AI-native analytics changes that equation. When business users can explore trusted data themselves, analysts can spend more time on the work that matters: understanding the business, validating assumptions, uncovering opportunities, and helping organizations make better decisions.

The analyst doesn’t become less important. Their expertise becomes more valuable and reaches more people.

Andy MacMillan: Analysts are evolving into ‘builders’. They use AI tools to design and deploy automated solutions, defining the business rules and calculations that serve as the foundation for enterprise-wide analysis.

Transformation barriers & autonomous execution: managing the blast radius

As enterprise AI evolves toward autonomous agents that take action, what are the primary hurdles, and where must human judgment remain absolute?

Bill Urciuoli: When people discuss transformation barriers, they usually point to technical debt or organizational culture. I take a slightly contrarian view: the biggest hurdle is simply where people’s time is already committed. Teams are locked into legacy operational cadence, making it difficult to pause and re-architect workflows.

Andy MacMillan: There is also a critical distinction between trusting data, trusting an AI answer, and trusting autonomous execution. As we move toward AI agents that act, we have to evaluate the ‘blast radius’ of any automated decision.

- What AI can own: Mundane background research, initial data preparation, pattern identification, and routine workflow execution.

- What humans must always own: Final decision ownership and risk assessment. Even if an AI agent recommends or executes an action, a human must ultimately be accountable for the outcome.

François Ajenstat: The goal is to achieve fluid exploration without giving up governance, security, or control. By pairing Golden Analytics’ fluid front-end experience with Alteryx’s governed data layer, organizations strike the right balance: speed for the user and confidence for the enterprise.

Solving the trust equation isn’t about halting AI adoption; it is about establishing the visible, auditable foundations required to scale it safely. When enterprise business logic is grounded and analysts are empowered to own business questions, AI shifts from an uncertain experiment to a reliable operating layer for the business.

Watch the full discussion on-demand

Missed the live broadcast or want to revisit the full conversation? You can access the complete, unscripted session on demand.

- Speakers: Andy MacMillan (CEO, Alteryx), François Ajenstat (CEO, Golden Analytics), Bill Urciuoli (CTO, McGarrah Jessee)

- Topics Covered: Solving the trust equation, elevating human expertise, and managing autonomous AI execution.

Class (B2B/B2C)
B2B
Ingest Status
Rewritten
Dedupe hash
b44f2a72133faf793c9dd7530c44c417
Press Eligible
Yes
Press Eligible Reason
Enterprise AI analytics discussion focused on data governance, trust, and business workflows.
Source Name
Alteryx, Inc.
Original Summary

An Executive Panel with Andy MacMillan, François Ajenstat, and Bill Urciuoli AI is making…

Image URL
https://www.alteryx.com/wp-content/uploads/trust-webinar-blog.png
Source Node
Content Hash (SHA-256, erste 32 hex)
a9d2bbeb920c36d039bf5688820d7d97
Stop Paying AI To Re-Learn Your Finance Rules
Image File
Original HTML

Finance now answers for enterprise AI twice. In Deloitte’s Finance Trends 2027 survey of more than 1,400 finance leaders, 48% oversee AI trust, including the reliability, accuracy, and explainability of what AI produces. Another 48% manage AI spending and cost controls. More than two-thirds of the leaders holding these responsibilities took them on within the past three years.

So finance inherited AI’s bill and AI’s credibility in the same short stretch, and most organizations sorted the two by default. Cost went to one workstream, with usage dashboards and approval gates. Trust went to another, with governance frameworks and model policies. Two owners, two budgets.

That split is the expensive mistake. The conditions that make AI spend hard to predict are the same ones that make AI answers hard to defend, and a finance team that fixes them at the source fixes both.

Confident on governance, unsure of the bill

The tension already shows in how CFOs describe their own position. In Deloitte’s Q2 2026 CFO Signals survey, 96% of North American CFOs said they were confident in their AI governance framework. In the same survey, 43% cited insufficient visibility into AI tools or use, and 46% named cost uncertainty or transparency as their biggest internal AI concern.

On the surface, those look like two separate gaps, one in governance and one in budgeting. They share a cause. Finance can’t see the work AI is doing clearly enough to vouch for its answers, and for the same reason it can’t forecast what those answers will cost. A governance framework sets the rules for AI use; seeing what AI actually did takes something more.

Why the AI bill climbs and the answers drift

Ask an AI assistant why gross margin moved last quarter and watch what it has to figure out before it can answer: which entities are in scope, which FX rates apply, how intercompany eliminations are treated, where the cost allocations land. In most organizations those rules live in spreadsheets, close checklists, and the heads of a few senior analysts. Nothing puts them where a model can call on them, so the model reconstructs them from whatever context it’s handed.

It does that every time the question is asked. Each reconstruction consumes tokens, which is why AI spend climbs with adoption instead of leveling off. Each one can also land somewhere slightly different from the last, and none leaves a record of which rule was applied to which data.

The unpredictable bill and the untraceable answer come out of the same step. Splitting them across two workstreams means each team manages a symptom while the cause keeps running.

What the auditor and the budget both need

Auditors are arriving at the same place from the other direction. PCAOB amendments on technology-assisted analysis now apply to audits of fiscal years beginning on or after December 15, 2025, giving auditors explicit standards for judging the reliability of electronic information used as evidence. An AI-produced number that nobody can trace to its source data and the rule applied to it is a hard number to put in front of the audit team.

The cost evidence points the same way. In KPMG’s Q2 2026 Global AI Pulse, organizations with strong AI cost visibility, meaning cost-monitoring dashboards and cost reviews built into AI approvals, were five times as likely to report established ROI: 15% versus 3%.

Seeing what AI costs and seeing how AI reached an answer turn out to be one discipline. Both depend on knowing what ran, on which data, under which rules.

Build the logic once

The fix is a change in where the business logic lives, not a tighter cap on usage.

When finance defines its business rules once, in governed workflows, AI no longer has to reconstruct them. ERP and spreadsheet data is blended, cleaned, and validated before any model sees it. The variance logic and the allocation method are built and owned by finance, and anyone who needs to inspect them can. AI calls on that logic, applies it, and explains the result in plain language, while the heavy analysis runs once in the workflow instead of being re-reasoned on every request.

Two things improve at the same moment. Answers become traceable, so any number leads back to the data and the rule that produced it, and the same question gets the same answer twice. Cost becomes predictable, because the expensive work is executed rather than re-derived, and one governed workflow serves every AI tool the enterprise adds instead of being rebuilt for each. Cheaper and right, from the same workflow.

That is the job of a business logic layer, and it’s the role Alteryx plays: sitting between enterprise data and the copilots, agents, and applications that consume it, so each one draws on logic finance already stands behind.

The experts are already in the building

The people who can write that logic down already work for you. They’re the finance professionals who know why a variance looks wrong before anyone reruns the numbers and which accruals need special handling at quarter-end. AI made that knowledge more valuable, and capturing it asks nothing of them in Python or any other code.

They build the rules visually, step by step, in the same terms they’d use to walk a colleague through the process. That keeps the logic understandable to the people who have to rely on it, from the auditor testing a control to the CFO signing off on a number. Once it’s encoded in governed workflows, that institutional knowledge stops being key-person risk and becomes an asset every AI tool in the enterprise can draw on.

For a CFO now accountable for both the AI bill and the defensibility of AI answers, that team is the point of leverage. Your AI bill has a finance solution. It’s your finance team.

Learn more about how CFOs can move AI pilots past the stall point, from applying a plain-language trust test to settling who owns governance. Alteryx CEO Andy MacMillan breaks it down in this webinar.

Class (B2B/B2C)
B2B
Ingest Status
Rewritten
Dedupe hash
ac3d0969d9845d09638f629079a4fdfe
Press Eligible
Yes
Press Eligible Reason
Manuelle Prüfung nötig. Risiko: MEDIUM. Flags: ['numbers']. Stichprobe: False
Source Name
Alteryx, Inc.
Original Summary

Finance now answers for enterprise AI twice. In Deloitte’s Finance Trends 2027 survey of…

Image URL
https://www.alteryx.com/wp-content/uploads/ai-costs-in-finance-1.jpeg
Source Node
Content Hash (SHA-256, erste 32 hex)
a0a83cb8b76b617c8460df49dc01e61a
Flex LNG – Q1 2026 Presentation
Original HTML

Skip to content

FLEX LNG

About us

Company Profile

Board of directors

Management

Media Archive

Shipping

LNG

Fleet List

Ship Management

2-Stroke Propulsion

Investor

Share Information

Share Price

Dividend

Analysts

AGM

Dividend Reinvestment Plan

News and Events

Press releases

Subscribe to press releases

Financial Calendar

Financial Information

Quarterly reports

Annual reports

ESG reports

Presentations

SEC filings

Governance

Governance

Investor Contact

FAQ

ESG

Contact us

Offices

Careers

Press releases

Wednesday May 13, 2026

Flex LNG – Q1 2026 Presentation

Post navigation

Flex LNG – First Quarter 2026 Presentation

Flex LNG – First Quarter 2026 Earnings Release

Class (B2B/B2C)
Ignore
Ingest Status
Rejected
Dedupe hash
8cdc505fe4bcd575017785c941ddf6df
Press Eligible
No
Press Eligible Reason
Text too short (93 words. Min: 150)
Source Name
Flex LNG
Original Summary

Flex LNG – Q1 2026 Presentation

Source Node
Content Hash (SHA-256, erste 32 hex)
3ccd1a5f1ce6eef75d6d4e43a68d1206