Nutraceutical Ingredients Market worth $161.53 billion by 2031- Exclusive Report by MarketsandMarkets™
Image File
Original HTML

Nutraceutical Ingredients Market worth $161.53 billion by 2031- Exclusive Report by MarketsandMarkets™

NEWS PROVIDED BY

MarketsandMarkets

Sep 01, 2026, 10:01 ET

SHARE THIS ARTICLE

DELRAY BEACH, Fla., Sept. 1, 2026 /PRNewswire/ -- According to MarketsandMarkets™, the global nutraceutical ingredients market is projected to grow from USD 108.33 billion in 2026 to reach USD 161.53 billion by 2031, at a CAGR of 7.3%.

Nutraceutical Ingredients Market Size & Forecast

Market Size Available for Years: 2022–2031

2026 Market Size: USD 108.33 billion

2031 Projected Market Size: USD 161.53 billion

CAGR (2026–2031): 7.3%

Nutraceutical Ingredients Market Trends & Insights:

The nutraceutical ingredients market is driven by increasing demand for nutritional and functional benefits across dietary supplements, functional foods and beverages, medical and specialized nutrition, and infant and early-life nutrition. Growing focus on preventive healthcare, healthy aging, sports nutrition, and personalized nutrition is supporting demand for targeted nutritional solutions, while increasing focus on animal health, digestive function, immunity, and performance is supporting demand for nutraceutical ingredients in animal nutrition. Advances in ingredient processing and formulation are further improving stability, bioavailability, and application flexibility.

Asia Pacific is expected to be the largest and fastest-growing region in the nutraceutical ingredients market, registering a CAGR of 11.3% during the forecast period.

By application, human nutrition held the largest share of the nutraceutical ingredients market in 2025 and is projected to be the fastest-growing segment during the forecast period, registering a CAGR of 8.49%.

By ingredient type, functional proteins held the largest share of the nutraceutical ingredients market in 2025, accounting for 44.34% of the total market.

By source, microbial-based ingredients are projected to be the fastest-growing segment of the nutraceutical ingredients market during the forecast period, registering a CAGR of 10.21%.

Download PDF Brochure: https://www.marketsandmarkets.com/pdfdownloadNew.asp?id=1319

The nutraceutical ingredients market is evolving as demand increases for ingredients that provide targeted nutritional and functional benefits across dietary supplements, functional foods and beverages, and animal nutrition products. Advances in ingredient processing, fermentation, and formulation technologies are enabling improvements in ingredient stability, bioavailability, consistency, and application performance across probiotics, prebiotics, omega-3 fatty acids, vitamins, minerals, amino acids, functional proteins, carotenoids, and specialty fibers. At the same time, manufacturers, in turn, are expanding their ingredient portfolios and developing solutions tailored to specific nutritional needs, including digestive health, immunity, healthy aging, sports nutrition, and animal health. As demand for targeted nutrition continues to rise, ingredient functionality, formulation flexibility, production scalability, and consistency are becoming increasingly important in the nutraceutical ingredients market.

By application, the human nutrition segment accounts for the largest share of the nutraceutical ingredients market.

By application, the human nutrition segment accounts for the largest share of the nutraceutical ingredients market. The segment benefits from growing consumer focus on preventive healthcare, rising incidence of lifestyle-related diseases, and strong demand for dietary supplements and products that support specific health needs. The expansion of functional foods and beverages is further increasing the use of nutraceutical ingredients in everyday nutrition, while the aging global population is driving demand for healthy aging and specialized nutritional products. In addition, growth in medical and specialized nutrition, infant and early-life nutrition, and personalized nutrition is broadening the range of applications within human nutrition. Urbanization and changing lifestyles are also increasing the demand for convenient nutrition products, supporting the wider adoption of nutraceutical ingredients across the human nutrition segment.

Request Sample Pages: https://www.marketsandmarkets.com/requestsampleNew.asp?id=1319

By source, the plant-based segment accounts for the largest share of the nutraceutical ingredients market.

By source, the plant-based segment accounts for the largest share of the nutraceutical ingredients market. Strong consumer preference for natural and clean-label ingredients, along with the growing adoption of vegan and flexitarian diets, is supporting the use of plant-derived ingredients across nutrition products. Plants provide a diverse source of bioactive compounds, including polyphenols, flavonoids, carotenoids, dietary fibers, phytosterols, antioxidants, and herbal extracts, which are used in products targeting a range of health and wellness needs. The broad availability of raw materials from fruits, vegetables, grains, legumes, herbs, spices, seeds, algae, and medicinal plants also provides manufacturers with flexibility in ingredient sourcing and product development. In addition, the growing demand for functional foods and beverages, plant-based beverages, dairy alternatives, snacks, and dietary supplements is increasing the use of plant-derived ingredients. Sustainability considerations and the lower environmental footprint associated with many plant-based sources further align with manufacturers' efforts to develop products that meet evolving consumer preferences.

Asia Pacific is set to account for the largest share of the nutraceutical ingredients market.

Asia Pacific accounts for the largest share of the nutraceutical ingredients market, supported by its large consumer base, rising health awareness, and growing demand for dietary supplements and functional nutrition products. Countries such as China, India, Japan, South Korea, and Australia have witnessed increasing interest in preventive healthcare, healthy aging, and nutrition products that address specific health needs. The region's expanding food and beverage industry is also supporting the use of nutraceutical ingredients in functional foods and beverages, while growing demand for medical and specialized nutrition is creating additional applications. In addition, urbanization and changing lifestyles are increasing demand for convenient nutrition products, and the growing adoption of personalized nutrition is encouraging more targeted product development. The availability of diverse raw materials and expanding ingredient manufacturing capabilities across the region further support the supply and use of nutraceutical ingredients, strengthening Asia Pacific's position in the market.

Top Companies in the Nutraceutical Ingredients Market 

The report profiles key players such as Cargill, Incorporated (US), ADM (US), International Flavors & Fragrances Inc. (US), BASF (Germany), Glanbia PLC (Ireland), Arla Foods amba (Denmark), Ingredion (US), Tate & Lyle (UK), Roquette Frères (France), Novonesis (Denmark), and Associated British Foods PLC (UK), among others.

Get 10% Free Customization on this Report: https://www.marketsandmarkets.com/requestCustomizationNew.asp?id=1319

Investment Funding Context

Investment activity in the nutraceutical ingredients market is increasingly focused on improving ingredient performance, expanding production capacity, and developing specialized nutrition solutions. In April 2026, EVANIUM raised EUR 2.2 million (~USD 2.6 million) in seed funding led by FoodLabs and Feast Ventures, with participation from existing angel investors. The funding will support the scale-up of its OPTISOLV technology, expansion of its ingredient portfolio, clinical studies, and commercial partnerships in nutraceuticals, nutricosmetics, and functional foods. In May 2024, Tate & Lyle opened new production capacity for PROMITOR Soluble Fibres at its facility in Boleráz, Slovakia, following a EUR 25 million (~USD 27.1 million) investment to increase dietary fiber production capacity and expand existing and new product lines. In June 2023, Fonterra invested USD 10 million in Pendulum Therapeutics through its Nutrition Science Solutions venture arm to co-develop and commercialize next-generation microbiome products, with the partnership focused on expanding microbiome-based nutrition solutions.

Revenue Shift Context

The global nutraceutical ingredients market is shifting toward functional and targeted nutrition solutions, supported by rising demand for dietary supplements, functional foods and beverages, specialized nutrition products, and animal nutrition. Market spending is projected to increase from USD 108.33 billion in 2026 to USD 161.53 billion by 2031, at a CAGR of 7.3%, with demand supported by growing consumer focus on digestive health, immunity, healthy aging, sports nutrition, and other specific health benefits. This is increasing the use of ingredients such as probiotics, prebiotics, omega-3 fatty acids, amino acids, vitamins, minerals, carotenoids, and functional proteins across a broad range of nutrition applications. Manufacturers are also focusing on ingredient functionality, formulation flexibility, bioavailability, and evidence-backed benefits, while advances in fermentation and processing technologies are enabling the development of more specialized ingredients.

Mergers and Acquisitions

Key players have pursued acquisitions to strengthen their portfolios across key nutraceutical ingredient segments. In January 2026, Glanbia acquired Scicore Nutra for an initial consideration of USD 15.1 million, complementing its Health & Nutrition business with nutritional product manufacturing capabilities. In November 2024, Arla Foods Ingredients acquired Volac's Whey Nutrition business, adding whey protein manufacturing capabilities and strengthening its position in health and sports nutrition. In July 2023, dsm-firmenich acquired Adare Biome for an enterprise value of EUR 275 million (USD 299 million), strengthening its postbiotic portfolio for dietary supplements, early-life nutrition, medical nutrition, and animal health applications.

NUTRACEUTICAL INGREDIENTS MARKET: MERGERS AND ACQUISITIONS, APRIL 2021–JANUARY 2026

Month & Year

Deal Type

Company 1

Company 2

Description

Jan-26

Acquisition

Glanbia PLC (Ireland)

Scicore Nutra Private Limited (India)

Glanbia acquired Scicore Nutra Private Limited for an initial consideration of USD 15.1 million, plus deferred consideration of up to USD 1.3 million. Scicore is an India-based nutritional products manufacturing business and represents a complementary acquisition for Glanbia's Health & Nutrition segment.

Nov-24

Acquisition

Arla Foods amba (Denmark)

Volac International Limited (UK)

Arla Foods Ingredients completed the acquisition of Volac's Whey Nutrition business following regulatory approval. The transaction transferred Volac's whey nutrition operations, including the Felinfach manufacturing site and its whey protein ingredient activities, to Arla Foods Ingredients.

Jul-23

Acquisition

dsm-firmenich (Netherlands)

Adare Biome (France)

dsm-firmenich completed the acquisition of Adare Biome, a developer and manufacturer of postbiotics. The transaction strengthened dsm-firmenich's B2B postbiotic portfolio, with further development directed toward dietary supplements, early-life nutrition, medical nutrition and nutrition-improvement applications.

Company Revenue Share Details

The global nutraceutical ingredients market remains highly fragmented, with the top five companies, namely Cargill, dsm-firmenich, ADM, Roquette, and Glanbia, estimated to account for approximately 10% of the market. These companies compete through broad ingredient portfolios spanning proteins, probiotics, fibers, vitamins, minerals, omega-3 fatty acids, and other specialty ingredients, serving applications across dietary supplements, functional foods and beverages, and animal nutrition. The remaining market share is distributed among a large number of regional and specialized ingredient manufacturers, reflecting the diverse product categories and applications covered by the nutraceutical ingredients market.

Browse Adjacent Reports @ Food and Beverage Market Research Reports & Consulting

Related Reports:

Protein Ingredients Market by Source (Animal, Plant, Insect, Microbial), Form (Dry, Liquid), Application (Food & Beverage, Feed, Cosmetics & Personal Care, Pharmaceutical), Functionality, and Region - Global Forecast to 2031

Nutraceutical Gummies Market by Type (B2B, B2C), Product Type (Vitamins, Minerals, Omega-3 Fatty Acids), Consumer Type, Production Capacity, Ingredient Source, Functionality, Demographics, Sales Channel, and Region – Global Forecast to 2030

About MarketsandMarkets™  

MarketsandMarkets™ has been recognized as one of America's Best Management Consulting Firms by Forbes, as per their recent report.

MarketsandMarkets™ is a blue ocean alternative in growth consulting and program management, leveraging a man-machine offering to drive supernormal growth for progressive organizations in the B2B space. With the widest lens on emerging technologies, we are proficient in co-creating supernormal growth for clients across the globe.

Today, 80% of Fortune 2000 companies rely on MarketsandMarkets, and 90 of the top 100 companies in each sector trust us to accelerate their revenue growth. With a global clientele of over 13,000 organizations, we help businesses thrive in a disruptive ecosystem.

The B2B economy is witnessing the emergence of $25 trillion in new revenue streams that are replacing existing ones within this decade. We work with clients on growth programs, helping them monetize this $25 trillion opportunity through our service lines – TAM Expansion, Go-to-Market (GTM) Strategy to Execution, Market Share Gain, Account Enablement, and Thought Leadership Marketing.

Built on the 'GIVE Growth' principle, we collaborate with several Forbes Global 2000 B2B companies to keep them future-ready. Our insights and strategies are powered by industry experts, cutting-edge AI, and our Market Intelligence Cloud, KnowledgeStore™, which integrates research and provides ecosystem-wide visibility into revenue shifts.

MarketsandMarkets™ SalesPlay is an AI-driven Revenue Intelligence Co-Pilot designed to help revenue teams prioritize the right accounts, identify critical changes early, and surface opportunities ahead of demand, so pipeline builds naturally and deals close with greater consistency.

To find out more, visit www.MarketsandMarkets™.com or follow us on Twitter, LinkedIn and Facebook.

Contact:

Mr. Rohan Salgarkar

MarketsandMarkets™ INC.

1615 South Congress Ave.

Suite 103, Delray Beach, FL 33445

USA: +1-888-600-6441

Email: sales@marketsandmarkets.com

Research Insight: https://www.marketsandmarkets.com/ResearchInsight/nutraceutical-ingredient-market.asp

Visit Our Website: https://www.marketsandmarkets.com/

Content Source: https://www.marketsandmarkets.com/PressReleases/nutraceutical-ingredient.asp


SOURCE MarketsandMarkets

21%

more press release views with 

Request a Demo

Class (B2B/B2C)
B2B
Ingest Status
Rewritten
Dedupe hash
b30d9699325caf449663af9906eafe0f
Press Eligible
Yes
Source Name
Unknown Company
Original Summary

<p>DELRAY BEACH, Fla., Sept. 1, 2026 /PRNewswire/ -- According to MarketsandMarkets™, the global nutraceutical ingredients market is projected to grow from USD 108.33 billion in 2026 to reach USD 161.53 billion by 2031, at a CAGR of 7.3%. Nutraceutical Ingredients Market Size & Forecast...</p>

Image URL
https://mmx.prnewswire.com/media/MS1173081/MarketsandMarkets-Logo.jpg?id=OA2922592&p=facebook
Blood Cancer Treatment Advances Have Saved Nearly 26 Million Years of Life Over Past 75 Years
Image File
Original HTML

Blood Cancer Treatment Advances Have Saved Nearly 26 Million Years of Life Over Past 75 Years

NEWS PROVIDED BY

Blood Cancer United® formerly The Leukemia & Lymphoma Society

Sep 01, 2026, 10:01 ET

SHARE THIS ARTICLE

New analysis introduces a life-years saved methodology to track how research funding, health care policy and access to treatment translate into more time for patients

WASHINGTON, Sept. 1, 2026 /PRNewswire/ -- A new analysis published today in Blood Advances introduces a novel "life-years saved" methodology that, for the first time, quantifies the impact of blood cancer treatment advances over the past 75 years, starting when the first chemotherapies emerged. The methodology translates decades of scientific progress into something universally meaningful: more time.

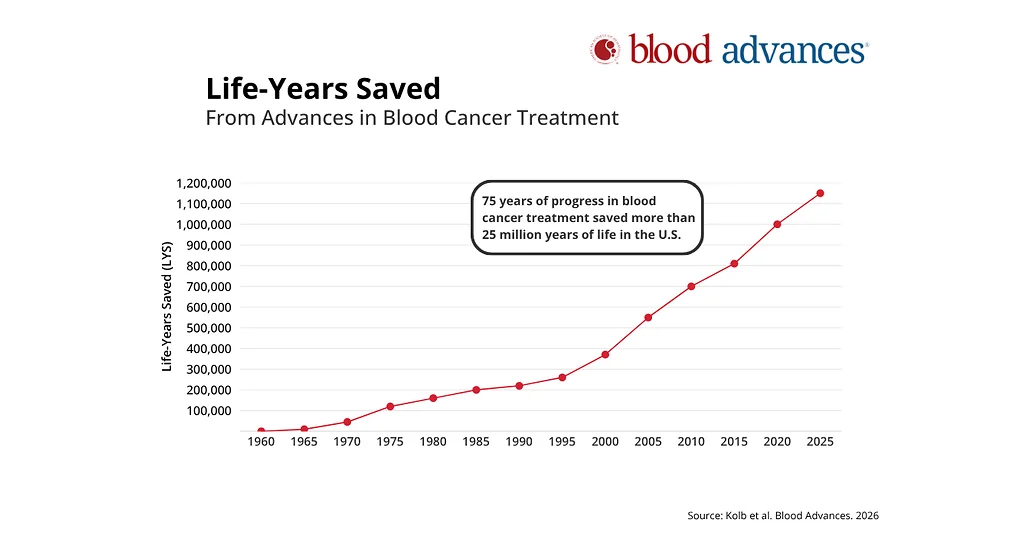
75 years of progress in blood cancer treatment has saved more than 25 million years of life in the U.S.

Surges in life-years that coincided with the approval of key blood cancer treatments.

The research led by Blood Cancer United is a retrospective analysis to examine progress from 1949, when the first blood cancer chemotherapies emerged, through 2024. The analysis found that advances in therapies for leukemia, lymphoma, myeloma and other blood cancers have resulted in an estimated 25.8 million life-years saved in the United States over the past 75 years. Using data from the National Cancer Institute's Surveillance, Epidemiology and End Results (SEER) Program, and integrating cancer incidence, mortality and U.S. life expectancy, the life-years saved methodology calculates the amount of life restored because of therapeutic innovation.

Blood cancers account for nearly 10% of all cancer diagnoses in the United States, and incidence has continued to rise over time, with more than 192,000 new cases expected this year. Unlike many solid tumor cancers where prevention and screening drive improved survival, progress against blood cancers depends almost entirely on therapeutic innovation and access to treatment.

"As blood cancer incidence continues to rise and more patients depend on ongoing or lifelong treatment for survival, traditional measures such as five-year survival rates and mortality rates do not capture the full story of progress against blood cancer," says E. Anders Kolb, M.D., president and CEO at Blood Cancer United. "Life-years saved – the number of additional years of life gained because of treatment advances – provides a more meaningful way to monitor progress over time and assess how changes in healthcare policy, research funding and access to treatment may impact patients' lives."

Life-years saved gives researchers, advocates and policymakers a new way to measure whether scientific advances and access to care are translating into more time for blood cancer patients. This comes at a critical time as remarkable scientific advances over the past few decades have led to life-saving therapies, but continued progress depends on sustained research funding, faster development of promising treatments, clinical trial participation, improving access to care, and healthcare policies that help patients navigate and afford care.

The analysis also highlights significant gaps across diseases and racial groups. Survival progress remains limited for people diagnosed with acute myeloid leukemia (AML) and across most major blood cancer types among Black individuals.

"This new methodology gives us a clear, intuitive way to measure progress, and to see where we must accelerate it," says co-author Ann-Kathrin Eisfeld, M.D., a hematologic oncologist at The Ohio State University Comprehensive Cancer Center – Arthur G. James Cancer Hospital and Richard J. Solove Research Institute (OSUCCC – James). "While millions of life-years have been gained, the data show stark gaps, particularly for Black patients and those with acute myeloid leukemia. Continued investment in research and equitable access to advanced therapies are essential to ensuring all patients benefit from scientific progress. Now we will be able to track progress, or the lack thereof, moving forward, to be able to provide feedback for critical need areas—and required investments."

Key Findings

Nearly 26 million life years saved, with future progress dependent on investment in research and treatment access

Researchers estimate that blood cancer treatments have saved 25.8 million life-years from 1949 through 2024.

On the current trajectory, blood cancer therapies are expected to add 18.9 million life-years from 2026 to 2040, but that projection is not a target or guarantee. Health policy changes that limit coverage, create barriers to care, or limit access to effective treatments could significantly slow progress.

Accelerating scientific innovation and expanding access to care could accelerate the trajectory by 1 million additional life-years by 2040 (with an estimated range of 0.8 million to 1.5 million) beyond what would otherwise be achieved. This is the opportunity Blood Cancer United is working to realize through its Bold Goal.

Early gains in life‑years saved were driven by cytotoxic therapy, radiation and transplantation. Progress accelerated with the introduction of monoclonal antibodies, kinase inhibitors, and other targeted therapies.

Future progress will rely on innovative combinations, precision medicines and next-generation immunotherapies, including bispecific antibodies, antibody-drug conjugates, and cellular therapies.

Progress varies significantly by cancer type

Substantial improvement in Hodgkin lymphoma and acute lymphoblastic leukemia treatment began decades ago, leading to the largest cumulative life-years saved to this point (about 32% of the total life-years saved is for Hodgkin lymphoma and 25% for acute lymphoblastic leukemia).

Non-Hodgkin lymphoma accounts for about 21% of all life-years saved, driven by more recent advances in immunotherapies such as rituximab (approved in 1997) and the large incidence of non-Hodgkin lymphoma.

Acute myeloid leukemia shows the smallest gains, especially among older adults, pointing to the need for new first-in-class therapies.

Racial disparities persist

Black patients experience significantly worse survival than White patients across most blood cancers.

Multiple myeloma is a notable exception, with equitable or better outcomes for Black patients when access to treatment is comparable.

Path Forward

According to the authors, increasing life-years saved will require:

Sustained research investment across federal, nonprofit and industry sectors

Broader access to advanced therapies and effective treatments

Faster development of first-in-class drugs, especially for acute myeloid leukemia and other myeloid cancers

Targeted efforts to close racial and age-based survival disparities

These priorities align with Blood Cancer United's Bold Goal to enable people with blood cancer to gain more than 1 million years of life by 2040, beyond what would otherwise be achieved. Reaching that goal will require continued investment in research, faster therapeutic innovation and broader, more equitable access to effective treatments.

Blood Cancer United plans to develop an annual report to measure progress across blood cancers and toward its Bold Goal.

"The past 75 years prove that when we invest in scientific discovery, we give patients more time," says Dr. Kolb. "Every year of life matters, and millions more are within reach if we sustain research funding, accelerate the next generation of breakthroughs and ensure better access to treatment for everyone."

Study Contributors: This analysis was developed and conducted by researchers from Blood Cancer United and The Ohio State University Comprehensive Cancer Center – Arthur G. James Cancer Hospital and Richard J. Solove Research Institute (OSUCCC – James) in conjunction with Lumanity.

About Blood Cancer United®

Blood Cancer United® (formerly The Leukemia & Lymphoma Society) is the largest global nonprofit focused on blood cancer patient support, research, and advocacy. Since their founding in 1949, the organization has consistently evolved to better serve people affected by all 100-plus types of blood cancer. Blood Cancer United funds innovative research, offers free resources and personalized support, and advocates at state and national levels for more accessible and affordable healthcare for all patients. To learn more, visit www.BloodCancerUnited.org.

About Lumanity

Lumanity is a leading global strategic partner for biopharmaceutical companies, engineering breakthrough value to transform lives. We combine deep scientific, clinical, medical, regulatory, and commercial expertise with advanced technology and AI-driven tools to guide decisions and execution across the entire medicine value creation journey. With 1,200 experts conducting work in over 50 countries, we serve leading pharmaceutical and biotech companies worldwide, integrating strategy, evidence, engagement, and technology to accelerate and optimize access to life-changing medicines.

Media Contact

Sandra Salviejo

Senior Director, Communications, Blood Cancer United

Sandra.salviejo@bloodcancerunited.org 

SOURCE Blood Cancer United® formerly The Leukemia & Lymphoma Society

21%

more press release views with 

Request a Demo

Class (B2B/B2C)
B2C
Ingest Status
Rewritten
Dedupe hash
01fc25035d02381bb828ea6d8aa31e8c
Press Eligible
Yes
Source Name
Unknown Company
Original Summary

<p>New analysis introduces a life-years saved methodology to track how research funding, health care policy and access to treatment translate into more time for patients WASHINGTON, Sept. 1, 2026 /PRNewswire/ -- A new analysis published today in Blood Advances introduces a novel "life-years...</p>

Image URL
https://mmx.prnewswire.com/media/MS1978780/blood-cancer-treatment.jpg?id=OA2921399&p=facebook
Manufacturing PMI® at 54.6%; August 2026 ISM® Manufacturing PMI® Report
Image File
Original HTML

Manufacturing PMI® at 54.6%; August 2026 ISM® Manufacturing PMI® Report

NEWS PROVIDED BY

Institute for Supply Management

Sep 01, 2026, 10:00 ET

SHARE THIS ARTICLE

New Orders Growing; Production Growing; Employment Growing; Supplier Deliveries Slowing; Raw Materials Inventories Growing; Customers' Inventories Too Low; Prices Increasing; Imports Growing; Exports Growing

TEMPE, Ariz., Sept. 1, 2026 /PRNewswire/ -- Economic activity in the manufacturing sector expanded in August for the eighth consecutive month, say the nation's supply executives in the latest ISM® Manufacturing PMI® Report.

The report was issued today by Susan Spence, MBA, Chair of the Institute for Supply Management® (ISM®) Manufacturing Business Survey Committee.

"The Manufacturing PMI® registered 54.6 percent in August, 1 percentage point below the July figure of 55.6 percent. The overall economy continued in expansion for the 22nd month in a row. (A Manufacturing PMI® above 47.5 percent, over a period of time, generally indicates an expansion of the overall economy.) The New Orders Index expanded for the eighth consecutive month after four straight readings in contraction, registering 53.7 percent, down 3 percentage points compared to July's figure of 56.7 percent. The August reading of the Production Index (58.3 percent) is 0.2 percentage point lower than the 58.5 percent recorded in July. The Prices Index remained in expansion (or 'increasing' territory), registering 71.1 percent, the same reading as July. The Backlog of Orders Index registered 51.8 percent, down 3.2 percentage points compared to the 55 percent recorded in July. The Employment Index reading of 51.2 percent is down 1.6 percentage points from July's figure of 52.8 percent," says Spence.

"The Supplier Deliveries Index indicated slowing performance for the ninth month in a row after one month in 'faster' territory. The reading of 59.3 percent is up 0.4 percentage point from its July reading of 58.9 percent. (Supplier Deliveries is the only ISM® PMI® Reports index that is inversed; a reading of above 50 percent indicates slower deliveries, which is typical as the economy improves and customer demand increases.)

"The Inventories Index registered 50.6 percent, down 0.6 percentage point compared to July's reading of 51.2 percent. The Customers' Inventories Index reading of 42.8 percent is 2.1 percentage points higher compared to the 40.7 percent recorded in July.

"The New Export Orders Index gained 0.2 percentage point in August for a reading of 53.2 percent versus 53 percent last month. The Imports Index registered 52.5 percent, a loss of 3.2 percentage points since July's reading of 55.7 percent."

Spence continues, "In August, U.S. manufacturing activity remained in expansion territory, though it has lost ground in a number of key measures — namely, the New Orders, Backlog and Imports indexes. Of the five subindexes that make up the PMI®, the only one that grew faster than last month was Supplier Deliveries (up 0.4 percentage point), indicating a continuing slowdown of the supply chain.

"In August, 42 percent of the comments were positive and 58 percent negative, with a 1-to-1.4 ratio of positive to negative sentiment. Pricing volatility was mentioned in 57 percent of negative comments, the Iran war 30 percent, increasing lead times 46 percent and tariffs 29 percent. (Most comments mentioned multiple factors.)

"In August, three of four demand indicators (the New Orders, Backlog of Orders and New Export Orders indexes) remained in expansion, and the Customers' Inventories Index remained in 'too low' territory, contracting at a slower rate. A 'too low' status for the Customers' Inventories Index is usually considered positive for future production.

"Regarding output, the Production Index expanded for the 10th month in a row (though at a slower pace) with the positive-to-negative comment ratio dropping in August (2.2 positive comments for every negative one, versus a 3.3-to-1 ratio in July). The Employment Index remained in expansion but lost 1.6 percentage points. The positive-to-negative comments ratio on Employment also dropped (1.3-to-1, compared to 1.5-to-1 the previous month).

"Finally, inputs (defined as supplier deliveries, inventories, prices and imports) were mixed, with the Supplier Deliveries Index increasing another 0.4 percentage point, the Inventories Index declining 0.6 percentage point but staying in expansion, and Prices Index repeating its July reading of 71.1 percent, and the Imports Index losing 3.2 percentage points, to 52.5 percent versus 55.7 percent in July.

"Looking at the manufacturing economy, 22 percent of the sector's gross domestic product (GDP) contracted in August, compared to 20 percent in July, and 2 percent of manufacturing GDP was in strong contraction (defined as a composite PMI® of 45 percent or lower), compared to zero percent in July. The share of sector GDP with a PMI® at or below 45 percent is a good metric to gauge overall manufacturing weakness. Of the six largest manufacturing industries, five (Transportation Equipment; Petroleum & Coal Products; Computer & Electronic Products; Machinery; and Food, Beverage & Tobacco Products) expanded in August."

The 15 manufacturing industries reporting growth in August — listed in order — are: Primary Metals; Electrical Equipment, Appliances & Components; Miscellaneous Manufacturing; Textile Mills; Furniture & Related Products; Nonmetallic Mineral Products; Paper Products; Transportation Equipment; Fabricated Metal Products; Petroleum & Coal Products; Printing & Related Support Activities; Computer & Electronic Products; Plastics & Rubber Products; Machinery; and Food, Beverage & Tobacco Products. The two industries reporting a contraction in August are: Wood Products; and Chemical Products.

WHAT RESPONDENTS ARE SAYING

"The economy is annoying; it is getting in the way of otherwise good business. We are making great new products but struggling to compete when prices escalate due to things like tariffs and the conflict in the Strait of Hormuz. I fear that the inflation caused by these factors will lead to lower sales and lower spending power of our customers. Call it inflation! At some point, it leads to an economic downturn or at least an economic pain for many consumers. It's an uncertain year, our second in a row." [Chemical Products]

"For our building products division, profitability is not far off from last year despite economic headwinds, as our specialty products have maintained their market share and sales. Specific to IT, the rising costs in component inputs have caused some budgetary constraints as we plan for the 2027 fiscal year. However, we largely been able to keep costs close to historic consumer price index averages." [Chemical Products]

"Supply chain situation, especially in the electronics market, is going through another crisis even bigger and more complicated than during and post COVID-19. That's mainly due to AI infrastructure and uncertainties in the global market (for oil and other critical supplies) due to war in the Middle East and more complication on trade rules." [Computer & Electronic Products]

"Supply markets are increasingly challenging due to inflation and supply availability. Each month has been more difficult than the previous one. Starting to resemble the post-COVID-19 disruptive period." [Computer & Electronic Products]

"Prices continue to rise on all goods. Suppliers are noting that energy, steel and labor costs are increasing very quickly. We continue to try to move products around to offset costs. We have moved more products to offshore sources to try to minimize cost impacts." [Machinery]

"Photonics, high speed connectors, semiconductors and government orders are expanding significantly. Supply chains domestically and globally are difficult, with increases in lead times and cost." [Machinery]

"Commentary this month echoes that of recent months: (1) significant availability/price challenges in commodities heavily consumed by AI, (2) great uncertainty over when the Iran conflict will end, and (3) another round of shifting U.S. tariff policy. Despite these tensions, we continue to focus on what we can control, and the market for our products remains strong." [Miscellaneous Manufacturing]

"This month is a blur: Steel prices continue to climb as supply diminishes, aluminum is rising after dropping, and there are many holes on the plate side. Demand seems to be a seesaw. Our prediction ability continues to diminish, with the exception that the year will remain difficult until the end." [Primary Metals]

"High steel and aluminum prices (due to Section 232 tariffs) continue to make profitability a challenge. Uncertainty over the U.S.-Mexico-Canada Agreement is at the forefront of many customer conversations. Our industry has also been hit with countervailing and anti-dumping penalties, further raising the cost of equipment." [Transportation Equipment]

"Volume is consistent. Our main customer is shifting production from U.S. plants to Mexico plants." [Transportation Equipment]

MANUFACTURING AT A GLANCE

August 2026

Index

Series

Index

Aug

Series

Index

Jul

Percentage

Point

Change

Direction

Rate of

Change

Trend*

(Months)

Manufacturing

PMI®

54.6

55.6

-1.0

Growing

Slower

8

New Orders

53.7

56.7

-3.0

Growing

Slower

8

Production

58.3

58.5

-0.2

Growing

Slower

10

Employment

51.2

52.8

-1.6

Growing

Slower

2

Supplier

Deliveries

59.3

58.9

+0.4

Slowing

Faster

9

Inventories

50.6

51.2

-0.6

Growing

Slower

3

Customers'

Inventories

42.8

40.7

+2.1

Too Low

Slower

23

Prices

71.1

71.1

0

Increasing

Same

23

Backlog of

Orders

51.8

55.0

-3.2

Growing

Slower

8

New Export

Orders

53.2

53.0

+0.2

Growing

Faster

2

Imports

52.5

55.7

-3.2

Growing

Slower

7

OVERALL ECONOMY

Growing

Slower

22

Manufacturing Sector

Growing

Slower

8

ISM® Manufacturing PMI® Report data is seasonally adjusted for the New Orders, Production, Employment and Inventories indexes.

*Number of months moving in current direction.

COMMODITIES REPORTED UP/DOWN IN PRICE AND IN SHORT SUPPLY

Commodities Up in Price

Aluminum* (33); Chemicals; Copper (14); Copper Products; Corrugated Products (5); Diesel Fuel; Electrical Components (3); Electronic Components (8); Freight (6); Fuel (6); Memory Components (6); Metal Products (5); Oil Based Products (5); Plastic Based Products (5); Printed Circuit Boards (2); Resin Based Products (2); Resins (7); Semiconductors (3); Steel (10); Steel — Cold Rolled (2); Steel — Hot Rolled (8); Steel — Stainless (7); Steel Products (9); and Wire.

Commodities Down in Price

Aluminum*(3); and Solvents.

Commodities in Short Supply

Copper (2); Electrical Components (14); Electronic Components (18); Labor; Memory (8); Printed Circuit Boards (2); Steel (2); and Tungsten Products (2).

Note: The number of consecutive months the commodity is listed is indicated after each item.

*Indicates both up and down in price.

August 2026 MANUFACTURING INDEX SUMMARIES

Manufacturing PMI®

The U.S. manufacturing sector expanded in August for the eighth straight month following a 10-month period of contraction, registering 54.6 percent, a decrease of 1 percentage point compared to July. Of the five subindexes that directly factor into the Manufacturing PMI® — the New Orders, Production, Employment, Supplier Deliveries and Inventories indexes — all were in expansion territory, the same as in July. Of the six largest manufacturing industries, five (Transportation Equipment; Petroleum & Coal Products; Computer & Electronic Products; Machinery; and Food, Beverage & Tobacco Products) expanded in August. A reading above 50 percent indicates that the manufacturing sector is generally expanding; below 50 percent indicates that it is generally contracting.

A Manufacturing PMI® above 47.5 percent, over a period of time, generally indicates an expansion of the overall economy. Therefore, the August Manufacturing PMI® indicates the overall economy grew for the 22nd straight month. "The past relationship between the Manufacturing PMI® and the overall economy indicates that August reading (54.6 percent) corresponds to a 2.4-percent increase in real gross domestic product (GDP) on an annualized basis," says Spence.

THE LAST 12 MONTHS

Month

Manufacturing

PMI®

Month

Manufacturing

PMI®

Aug 2026

54.6

Feb 2026

52.4

Jul 2026

55.6

Jan 2026

52.6

Jun 2026

53.3

Dec 2025

47.9

May 2026

54.0

Nov 2025

48.0

Apr 2026

52.7

Oct 2025

48.8

Mar 2026

52.7

Sep 2025

48.9

Average for 12 months – 51.8

High – 55.6

Low – 47.9

New Orders

ISM®'s New Orders Index expanded in August with a reading of 53.7 percent, a decrease of 3 percentage points compared to July's reading of 56.7 percent. "Of the six largest manufacturing industries, three (Computer & Electronic Products; Machinery; and Transportation Equipment) reported increased new orders. Demand sentiment was less optimistic in August, with a 2-to-1 ratio of positive to negative comments (versus 3.5-to-1 in July)," says Spence. A New Orders Index above 51.9 percent, over time, is generally consistent with an increase in the Census Bureau's series on manufacturing orders (in constant 2000 dollars).

The 11 manufacturing industries that reported growth in new orders in August, in order, are: Textile Mills; Miscellaneous Manufacturing; Primary Metals; Furniture & Related Products; Nonmetallic Mineral Products; Computer & Electronic Products; Machinery; Electrical Equipment, Appliances & Components; Transportation Equipment; Fabricated Metal Products; and Plastics & Rubber Products. The three industries reporting a decline in new orders in August are: Wood Products; Chemical Products; and Food, Beverage & Tobacco Products.

New Orders

%Higher

%Same

%Lower

Net

Index

Aug 2026

19.0

65.4

15.6

+3.4

53.7

Jul 2026

25.6

60.2

14.2

+11.4

56.7

Jun 2026

22.3

64.3

13.4

+8.9

56.0

May 2026

30.9

55.2

13.9

+17.0

56.8

Production

The Production Index expanded in August for the 10th month in a row, registering 58.3 percent, a 0.2 percentage point decrease compared to July's reading of 58.5 percent. "Of the six largest manufacturing industries, four (Petroleum & Coal Products; Transportation Equipment; Machinery; and Chemical Products) reported increased production. Panelists had a 2.2-to-1 ratio of positive to negative comments regarding output," says Spence. An index above 52 percent, over time, is generally consistent with an increase in the Federal Reserve Board's Industrial Production figures.

The 12 industries reporting growth in production during the month of August — listed in order — are: Petroleum & Coal Products; Primary Metals; Miscellaneous Manufacturing; Textile Mills; Plastics & Rubber Products; Electrical Equipment, Appliances & Components; Furniture & Related Products; Transportation Equipment; Paper Products; Machinery; Chemical Products; and Fabricated Metal Products. Two industries reported a decrease in production in August are: Wood Products; and Computer & Electronic Products.

Production

%Higher

%Same

%Lower

Net

Index

Aug 2026

25.1

62.9

12.0

+13.1

58.3

Jul 2026

25.1

64.5

10.4

+14.7

58.5

Jun 2026

19.0

68.0

13.0

+6.0

52.2

May 2026

26.7

57.8

15.5

+11.2

54.3

Employment

ISM®'s Employment Index registered 51.2 percent in August, 1.6 percentage points lower than July's reading of 52.8 percent. "Of the six big manufacturing industries, only Transportation Equipment reported higher levels of employment in August. The panelist comment ratio of hiring to managing/reducing head counts was 1.3-to-1," says Spence. An Employment Index above 50.3 percent, over time, is generally consistent with an increase in the Bureau of Labor Statistics (BLS) data on manufacturing employment.

Of the 18 manufacturing industries, seven reported employment growth in August, in the following order: Printing & Related Support Activities; Primary Metals; Electrical Equipment, Appliances & Components; Paper Products; Miscellaneous Manufacturing; Transportation Equipment; and Fabricated Metal Products. The three industries reporting a decrease in employment in August are: Textile Mills; Food, Beverage & Tobacco Products; and Chemical Products. Eight industries reported no change in employment in August.

Employment

%Higher

%Same

%Lower

Net

Index

Aug 2026

11.8

76.7

11.5

+0.3

51.2

Jul 2026

16.3

70.4

13.3

+3.0

52.8

Jun 2026

16.2

70.0

13.8

+2.4

49.7

May 2026

17.0

67.6

15.4

+1.6

48.6

Supplier Deliveries†

Delivery performance of suppliers to manufacturing organizations was slower in August for the ninth consecutive month. "The Supplier Deliveries Index registered 59.3 percent, 0.4 percentage point higher than July's reading of 58.9 percent. Of the six big industries, five (Computer & Electronic Products; Food, Beverage & Tobacco Products; Machinery; Chemical Products; and Transportation Equipment) reported slower supplier deliveries," says Spence. A reading below 50 percent indicates faster deliveries, while a reading above 50 percent indicates slower deliveries.

The 14 manufacturing industries reporting slower supplier deliveries in August, in order, are: Nonmetallic Mineral Products; Computer & Electronic Products; Textile Mills; Wood Products; Plastics & Rubber Products; Electrical Equipment, Appliances & Components; Food, Beverage & Tobacco Products; Primary Metals; Machinery; Fabricated Metal Products; Paper Products; Miscellaneous Manufacturing; Chemical Products; and Transportation Equipment. No industries reported that supplier deliveries were faster in August compared to July.

Supplier Deliveries

%Slower

%Same

%Faster

Net

Index

Aug 2026

21.9

74.7

3.4

+18.5

59.3

Jul 2026

21.3

75.2

3.5

+17.8

58.9

Jun 2026

18.1

78.5

3.4

+14.7

57.4

May 2026

24.6

71.9

3.5

+21.1

60.6

Inventories

The Inventories Index registered 50.6 percent in August, down 0.6 percentage point compared to the reading of 51.2 percent in July. "Of the six big industries, two (Transportation Equipment; and Computer & Electronic Products) expanded inventories in August," says Spence. An Inventories Index greater than 44.5 percent, over time, is generally consistent with expansion in the Bureau of Economic Analysis (BEA) figures on overall manufacturing inventories (in chained 2000 dollars).

Of 18 manufacturing industries, the seven reporting higher inventories in August — in the following order — are: Textile Mills; Furniture & Related Products; Transportation Equipment; Fabricated Metal Products; Electrical Equipment, Appliances & Components; Primary Metals; and Computer & Electronic Products. The five industries reporting lower inventories in August are: Plastics & Rubber Products; Machinery; Miscellaneous Manufacturing; Chemical Products; and Wood Products. Six industries reported no change in inventories in August compared to July.

Inventories

%Higher

%Same

%Lower

Net

Index

Aug 2026

14.7

73.6

11.7

+3.0

50.6

Jul 2026

11.0

78.5

10.5

+0.5

51.2

Jun 2026

15.4

70.4

14.2

+1.2

51.4

May 2026

18.1

65.4

16.5

+1.6

49.9

Customers' Inventories†

ISM®'s Customers' Inventories Index remained in "too low" territory in August, with reading of 42.8 percent, an increase of 2.1 percentage points compared to the 40.7 percent reported in July. (For more information about the Customers' Inventories Index, see the "Data and Method of Presentation" section below.)

The two industries that reported that customers' inventories were too high in August are: Wood Products; and Miscellaneous Manufacturing. The 11 industries reporting customers' inventories as too low in August, in order, are: Textile Mills; Plastics & Rubber Products; Computer & Electronic Products; Fabricated Metal Products; Electrical Equipment, Appliances & Components; Food, Beverage & Tobacco Products; Primary Metals; Machinery; Chemical Products; Transportation Equipment; and Nonmetallic Mineral Products.

Customers'

Inventories

%

Reporting

%Too

High

%About

Right

%Too

Low

Net

Index

Aug 2026

75

7.3

70.9

21.8

-14.5

42.8

Jul 2026

74

6.8

67.7

25.5

-18.7

40.7

Jun 2026

78

7.5

69.5

23.0

-15.5

42.3

May 2026

73

7.0

71.3

21.7

-14.7

42.7

Prices†

The ISM® Prices Index registered 71.1 percent in August, the same as in July, indicating raw materials prices increased for the 23rd straight month. Of the six largest manufacturing industries, five — Machinery; Transportation Equipment; Computer & Electronic Products; Food, Beverage & Tobacco Products; and Chemical Products — reported price increases in August. "The Prices Index reading is still being driven by (1) increases in steel and aluminum prices that impact the entire value chain, (2) tariffs applied to many imported goods and (3) increases in petroleum-based products as a result of the Middle East conflict. Higher prices were reported by 46.2 percent of respondents in August, down 4 percentage points from July's 50.2 percent," says Spence. A Prices Index above 52.8 percent, over time, is generally consistent with an increase in the Bureau of Labor Statistics (BLS) Producer Price Index for Intermediate Materials.

In August, the 15 industries that reported paying increased prices for raw materials, in order, are: Textile Mills; Wood Products; Primary Metals; Furniture & Related Products; Fabricated Metal Products; Paper Products; Electrical Equipment, Appliances & Components; Miscellaneous Manufacturing; Machinery; Transportation Equipment; Computer & Electronic Products; Plastics & Rubber Products; Nonmetallic Mineral Products; Food, Beverage & Tobacco Products; and Chemical Products. No industries reported paying decreased prices for raw materials in August.

Prices

%Higher

%Same

%Lower

Net

Index

Aug 2026

46.2

49.8

4.0

+42.2

71.1

Jul 2026

50.2

41.7

8.1

+42.1

71.1

Jun 2026

55.1

35.7

9.2

+45.9

73.0

May 2026

66.3

31.5

2.2

+64.1

82.1

Backlog of Orders†

ISM®'s Backlog of Orders Index registered 51.8 percent in August, a decrease of 3.2 percentage points compared to the July reading of 55 percent. Of the six largest manufacturing industries, three (Computer & Electronic Products; Transportation Equipment; and Machinery) reported expansion in order backlogs in August.

The 11 industries reporting higher backlogs in August — listed in order — are: Textile Mills; Miscellaneous Manufacturing; Furniture & Related Products; Electrical Equipment, Appliances & Components; Fabricated Metal Products; Nonmetallic Mineral Products; Primary Metals; Plastics & Rubber Products; Computer & Electronic Products; Transportation Equipment; and Machinery. The four industries reporting lower backlogs in August are: Wood Products; Paper Products; Food, Beverage & Tobacco Products; and Chemical Products.

Backlog of

Orders

%

Reporting

%Higher

%Same

%Lower

Net

Index

Aug 2026

91

19.7

64.2

16.1

+3.6

51.8

Jul 2026

91

23.5

62.9

13.6

+9.9

55.0

Jun 2026

88

20.4

60.2

19.4

+1.0

50.5

May 2026

87

20.4

63.5

16.1

+4.3

52.2

New Export Orders†

ISM®'s New Export Orders Index remained in expansion territory in August, registering 53.2 percent, up 0.2 percentage point from July's reading of 53 percent. "Among panelists' comments, the positive-to-negative sentiment ratio was 2 to 1," says Spence.

Of the 18 manufacturing industries, the nine that reported growth in new export orders in August — listed in order — are: Furniture & Related Products; Paper Products; Nonmetallic Mineral Products; Miscellaneous Manufacturing; Primary Metals; Transportation Equipment; Food, Beverage & Tobacco Products; Chemical Products; and Computer & Electronic Products. The seven industries that reported a decrease in new export orders in August — in the following order — are: Wood Products; Petroleum & Coal Products; Textile Mills; Plastics & Rubber Products; Electrical Equipment, Appliances & Components; Fabricated Metal Products; and Machinery.

New Export

Orders

%

Reporting

%Higher

%Same

%Lower

Net

Index

Aug 2026

75

12.0

82.4

5.6

+6.4

53.2

Jul 2026

74

14.8

76.4

8.8

+6.0

53.0

Jun 2026

71

10.9

75.2

13.9

-3.0

48.5

May 2026

74

12.8

75.6

11.6

+1.2

50.6

Imports†

ISM®'s Imports Index registered 52.5 percent in August, a 3.2-percentage point decrease compared to July's reading of 55.7 percent.

The seven industries reporting higher imports in August — in the following order — are: Textile Mills; Transportation Equipment; Electrical Equipment, Appliances & Components; Plastics & Rubber Products; Machinery; Food, Beverage & Tobacco Products; and Chemical Products. The three industries that reported lower volumes in August are: Fabricated Metal Products; Computer & Electronic Products; and Miscellaneous Manufacturing. Eight industries reported no change in imports in August compared to July.

Imports

%

Reporting

%Higher

%Same

%Lower

Net

Index

Aug 2026

85

10.1

84.7

5.2

+4.9

52.5

Jul 2026

85

16.0

79.4

4.6

+11.4

55.7

Jun 2026

86

12.5

80.7

6.8

+5.7

52.9

May 2026

85

15.4

75.2

9.4

+6.0

53.0

†The Supplier Deliveries, Customers' Inventories, Prices, Backlog of Orders, New Export Orders, and Imports indexes do not meet the accepted criteria for seasonal adjustments.

Buying Policy

The average commitment lead time for Capital Expenditures in August was 171 days, one day less than July. The average lead time in August for Production Materials was 84 days, a decrease of three days compared to July. The average lead time for Maintenance, Repair and Operating (MRO) Supplies was 48 days, two days less than July.

Percent Reporting

Capital

Expenditures  

Hand-to-

Mouth

30 Days

60 Days

90 Days

6 Months

1 Year+

Average

Days

Aug 2026

18

3

8

13

31

27

171

Jul 2026

16

3

7

13

36

25

172

Jun 2026

16

5

7

15

30

27

171

May 2026

17

5

7

11

34

26

171


Percent Reporting

Production

Materials         

Hand-to-

Mouth

30 Days

60 Days

90 Days

6 Months

1 Year+

Average

Days

Aug 2026

10

24

26

23

12

5

84

Jul 2026

8

23

25

26

13

5

87

Jun 2026

8

23

28

26

10

5

84

May 2026

8

25

27

25

11

4

81


Percent Reporting

MRO Supplies

Hand-to-

Mouth

30 Days

60 Days

90 Days

6 Months

1 Year+

Average

Days

Aug 2026

29

37

18

9

5

2

48

Jul 2026

26

38

18

11

5

2

50

Jun 2026

28

35

17

13

6

1

48

May 2026

27

39

16

12

4

2

48

About This Report

DO NOT CONFUSE THIS NATIONAL REPORT with the various regional purchasing reports released across the country. The national report's information reflects the entire U.S., while the regional reports contain primarily regional data from their local vicinities. Also, the information in the regional reports is not used in calculating the results of the national report. The information compiled in this report is for the month of August 2026.

The data presented herein is obtained from a survey of manufacturing supply executives based on information they have collected within their respective organizations. ISM® makes no representation, other than that stated within this release, regarding the individual company data collection procedures. The data should be compared to all other economic data sources when used in decision-making.

Data and Method of Presentation

The ISM® Manufacturing PMI® Report is based on data compiled from purchasing and supply executives nationwide. The composition of the Manufacturing Business Survey Panel is stratified according to the North American Industry Classification System (NAICS) and each of the following NAICS-based industries' contribution to gross domestic product (GDP): Food, Beverage & Tobacco Products; Textile Mills; Apparel, Leather & Allied Products; Wood Products; Paper Products; Printing & Related Support Activities; Petroleum & Coal Products; Chemical Products; Plastics & Rubber Products; Nonmetallic Mineral Products; Primary Metals; Fabricated Metal Products; Machinery; Computer & Electronic Products; Electrical Equipment, Appliances & Components; Transportation Equipment; Furniture & Related Products; and Miscellaneous Manufacturing (products such as medical equipment and supplies, jewelry, sporting goods, toys and office supplies). The data are weighted based on each industry's contribution to GDP. According to U.S. Bureau of Economic Analysis (BEA) estimates (the average of the fourth quarter 2024 GDP estimate and the GDP estimates for first, second, and third quarter 2025, as released on January 22, 2026), the six largest manufacturing industries are: Chemical Products; Transportation Equipment; Food, Beverage & Tobacco Products; Computer & Electronic Products; Machinery; and Petroleum & Coal Products.

Survey responses reflect the change, if any, in the current month compared to the previous month. For nine indicators (New Orders, Backlog of Orders, New Export Orders, Imports, Production, Supplier Deliveries, Inventories, Employment, and Prices), this report shows the percentage reporting each response, the net difference between the number of responses in the positive economic direction (higher, better and slower for Supplier Deliveries) and the negative economic direction (lower, worse and faster for Supplier Deliveries), and the diffusion index. For Customers' Inventories, respondents report their assessment of their customers' stock levels of respondent companies' products this month (rather than last month): too high, about right, and too low. Responses are raw data and are never changed. The diffusion index includes the percent of positive responses plus one-half of those responding the same (considered positive).

The resulting single index number for those meeting the criteria for seasonal adjustments (Manufacturing PMI®, New Orders, Production, Employment and Inventories) is then seasonally adjusted to allow for the effects of repetitive intra-year variations resulting primarily from normal differences in weather conditions, various institutional arrangements, and differences attributable to non-moveable holidays. All seasonal adjustment factors are subject annually to relatively minor changes when conditions warrant them. The Manufacturing PMI® is a composite index based on the diffusion indexes of five of the indexes with equal weights: New Orders (seasonally adjusted), Production (seasonally adjusted), Employment (seasonally adjusted), Supplier Deliveries, and Inventories (seasonally adjusted).

Diffusion indexes have the properties of leading indicators and are convenient summary measures showing the prevailing direction of change and the scope of change. A Manufacturing PMI® reading above 50 percent indicates that the manufacturing economy is generally expanding; below 50 percent indicates that it is generally declining. A Manufacturing PMI® above 47.5 percent, over a period of time, indicates that the overall economy, or gross domestic product (GDP), is generally expanding; below 47.5 percent, it is generally declining. The distance from 50 percent or 47.5 percent is indicative of the extent of the expansion or decline. With some of the indicators within this report, ISM® has indicated the departure point between expansion and decline of comparable government series, as determined by regression analysis. For the Customers' Inventories Index, numerically, a reading: above 50 percent is "too high," equal to 50 percent is "about right," and below 50 percent is "too low." However, in practice and in the context of other data, customers' inventories may be considered to be "about right" if the diffusion index is between 52 percent (the high side of about right) and 48 percent (the low side of about right).

The ISM® Manufacturing PMI® Report survey is sent out to Manufacturing Business Survey Panel respondents the first part of each month. Respondents are asked to report on information for the current month for U.S. operations only. ISM® receives survey responses throughout most of any given month, with the majority of respondents generally waiting until late in the month to submit responses to give the most accurate picture of current business activity. ISM® then compiles the report for release on the first business day of the following month.

The industries reporting growth, as indicated in the ISM® Manufacturing PMI® Report, are listed in the order of most growth to least growth. For the industries reporting contraction or decreases, those are listed in the order of the highest level of contraction/decrease to the least level of contraction/decrease.

Responses to Buying Policy reflect the percent reporting the current month's lead time, the approximate weighted number of days ahead for which commitments are made for Capital Expenditures; Production Materials; and Maintenance, Repair and Operating (MRO) Supplies, expressed as hand-to-mouth (five days), 30 days, 60 days, 90 days, six months (180 days), a year or more (360 days), and the weighted average number of days. These responses are raw data, never revised, and not seasonally adjusted.

ISM PMI® Content

The Institute for Supply Management® ("ISM®") PMI® Reports, formerly Report On Business®, (Manufacturing and Services reports) ("ISM PMI®") contain information, text, files, images, video, sounds, musical works, works of authorship, applications, and any other materials or content (collectively, "Content") of ISM ("ISM PMI® Content"). ISM PMI® Content is protected by copyright, trademark, trade secret, and other laws, and as between you and ISM, ISM owns and retains all rights in the ISM PMI® Content. ISM hereby grants you a limited, revocable, nonsublicensable license to access and display on your individual device the ISM PMI® Content (excluding any software code) solely for your personal, non-commercial use. The ISM PMI® Content shall also contain Content of users and other ISM licensors. Except as provided herein or as explicitly allowed in writing by ISM, you shall not copy, download, stream, capture, reproduce, duplicate, archive, upload, modify, translate, publish, broadcast, transmit, retransmit, distribute, perform, display, sell, or otherwise use any ISM PMI® Content.

Except as explicitly and expressly permitted by ISM, you are strictly prohibited from creating works or materials (including but not limited to tables, charts, data streams, time-series variables, fonts, icons, link buttons, wallpaper, desktop themes, online postcards, montages, mashups and similar videos, greeting cards, and unlicensed merchandise) that derive from or are based on the ISM PMI® Content. This prohibition applies regardless of whether the derivative works or materials are sold, bartered, or given away. You shall not either directly or through the use of any device, software, internet site, web-based service, or other means remove, alter, bypass, avoid, interfere with, or circumvent any copyright, trademark, or other proprietary notices marked on the Content or any digital rights management mechanism, device, or other content protection or access control measure associated with the Content including geo-filtering mechanisms. Without prior written authorization from ISM, you shall not build a business utilizing the Content, whether or not for profit.

You shall not create, recreate, distribute, incorporate in other work, or advertise an index of any portion of the Content unless you receive prior written authorization from ISM. Requests for permission to reproduce or distribute ISM PMI® Content can be made by contacting in writing at: ISM Research, Institute for Supply Management, 350 W. Washington St., Suite 301, Tempe, AZ 85288, or by emailing kcahill@ismworld.org. Subject: Content Request.

ISM shall not have any liability, duty, or obligation for or relating to the ISM PMI® Content or other information contained herein, any errors, inaccuracies, omissions or delays in providing any ISM PMI® Content or for any actions taken in reliance thereon. In no event shall ISM be liable for any special, incidental, or consequential damages arising out of the use of the ISM PMI®. Report On Business®, PMI®, Manufacturing PMI® and Services PMI® are registered trademarks of Institute for Supply Management®. Institute for Supply Management® and ISM® are registered trademarks of Institute for Supply Management, Inc.

About Institute for Supply Management® (ISM®)

ISM is the world's first professional association for supply chain — founded in 1915, before the term 'supply chain' was widely used. We didn't enter this profession. We helped shape it. Today, we're a community of over 200,000 professionals in more than 100 countries — early-career practitioners building credentials, experienced leaders seeking strategic insight, and organizations developing their procurement teams that drive their business forward. What connects us is a shared belief that supply chain is strategic work that deserves world-class support. For more information, please visit: www.ismworld.org.

The full text version of the ISM® Manufacturing PMI® Report is posted on ISM®'s website at www.ismrob.org on the first business day* of every month after 10:00 a.m. ET. The one exception is in January when the report is released on the second business day of the month.

The next ISM® Manufacturing PMI® Report featuring September 2026 data will be released at 10:00 a.m. ET on Thursday, October 1, 2026.

*Unless the New York Stock Exchange is closed.

Contact:               

Kristina Cahill

PMI® Reports Analyst

ISM®, PMI®/Research Manager

Tempe, Arizona

+1 480.455.5910

Email: kcahill@ismworld.org

SOURCE Institute for Supply Management

21%

more press release views with 

Request a Demo
Class (B2B/B2C)
B2B
Ingest Status
Rewritten
Dedupe hash
7ffb6bb407d6f356a49881452f84fa41
Press Eligible
Yes
Source Name
Unknown Company
Original Summary

<p>New Orders Growing; Production Growing; Employment Growing; Supplier Deliveries Slowing; Raw Materials Inventories Growing; Customers' Inventories Too Low; Prices Increasing; Imports Growing; Exports Growing TEMPE, Ariz., Sept. 1, 2026 /PRNewswire/ -- Economic activity in the...</p>

Image URL
https://mmx.prnewswire.com/media/MS349053/INSTITUTE-FOR-SUPPLY-MANAGEMENT-LOGO-v1.jpg?id=OA2916983&p=facebook
New Study Finds Transmission Can Save Electricity Customers up to $15.3 Billion While Powering America's Economic Growth and Strengthening National Security
Image File
Original HTML

New Study Finds Transmission Can Save Electricity Customers up to $15.3 Billion While Powering America's Economic Growth and Strengthening National Security

NEWS PROVIDED BY

National Grid

Sep 01, 2026, 10:00 ET

SHARE THIS ARTICLE

National Grid, the Electricity Customer Alliance and Converge Strategies partner with S&P Global to analyze four major U.S. regions and identify transmission as the most cost-effective tool for meeting rising demand from AI, manufacturing and economic growth.

The study finds that when power from neighboring states is connected through a strong regional grid (interregional transmission), the savings for customers can be two to three times greater than when transmission is developed within individual regions alone.

WASHINGTON, Sept. 1, 2026 /PRNewswire/ -- As electricity demand accelerates across the United States for the first time in decades, a new study finds that strategic transmission investment can help meet that growth while lowering costs, improving reliability, and strengthening national security.

The study, "Powering Growth and Affordability: The Role of Transmission in Economic and National Security," was prepared by CERA Consulting, the consulting arm of S&P Global Energy, and commissioned by National Grid, the Electricity Customer Alliance (ECA), and Converge Strategies. The analysis examines how transmission investments can help meet rising demand across four regions of the Eastern Interconnection: the Northeast, PJM, SERC, and SPP/MISO South. Findings from the study are summarized here.

The study finds that building transmission is consistently one of the most cost-effective approaches for serving new electricity demand and that investments connecting regions deliver the greatest value to consumers.

Among the key findings:

Interregional transmission, when combined with robust regional transmission, provides the greatest value, with customer savings reaching up to $15.3 billion until 2050 – two to three times higher than scenarios without interregional connections.

Transmission reduces the need to build more expensive local generation by enabling regions to access lower-cost electricity from elsewhere on the grid.

Transmission becomes even more valuable in the future when energy demand rises, helping manage uncertainty associated with AI, data centers, advanced manufacturing, and industrial growth.

"America's economic future depends on having the infrastructure needed to power growth," said Matt Satterwhite, Senior Vice President, Head of US Policy and Regulatory Strategy, National Grid. "This analysis quantifies how transmission is not just a reliability investment, but an affordability investment. By strengthening connections between regions, we can serve growing demand at a lower cost while building a more resilient and secure energy system. This report makes clear the need for Congress to pass legislation to strengthen federal authority for strategic regional and interregional transmission planning, siting, and permitting."

"America is entering a new era of electricity demand driven by advanced manufacturing, artificial intelligence, defense infrastructure, and economic growth," said Jeff Dennis, Executive Director of the Electricity Customer Alliance. "This analysis demonstrates that strategically planned transmission investments are not simply about adding wires; they are about lowering costs, improving reliability, strengthening resilience, and giving customers access to the most cost-effective sources of electricity wherever they are located. As demand grows, failing to expand transmission where it provides clear economic value will result in higher electricity costs, constrained economic development, and unnecessary risks to reliability and energy affordability."

Transmission and National Security

In addition to evaluating economic benefits, the study examines the role of transmission infrastructure in supporting national security objectives.

Virtually every U.S. military installation depends on the commercial power grid, as do the nation's critical command, intelligence, manufacturing, and defense-industrial facilities. A significant share of these are located within the regions this study analyzes.

Among the national-security findings:

The electric grid serves as a foundational platform for military readiness and operations.

Interregional transmission provides critical backup capability during emergencies, allowing regions to support one another when local systems are strained or disruptions occur.

The defense industrial base, including shipyards, aerospace manufacturers, technology suppliers, and weapons producers cannot function without reliable electric infrastructure. A disruption to the grid is a disruption to production.

A stronger transmission system enhances resilience and reduces vulnerabilities from extreme weather, cyber threats, and physical attacks.

"The electric grid is critical national security infrastructure," said Jonathon Monken, Senior Partner at Converge Strategies. "Every command center, shipyard, and defense manufacturing site within this study's geographic footprint runs on commercial power. Strengthening interregional transmission ensures power reaches what matters most, keeping our interconnected defense operations reliable when energy challenges emerge."

For more information, visit ngrid.com/poweringgrowth.

About National Grid Ventures

National Grid Ventures (NGV), the commercial arm of National Grid plc, develops, builds and operates energy infrastructure that strengthens the power system and delivers reliable, affordable energy for communities.

In the U.S., NGV's portfolio includes competitive transmission, battery storage, solar, LNG storage, and conventional generation assets. A global leader in transmission infrastructure, NGV operates the world's largest portfolio of high voltage subsea interconnectors in Europe and is applying that expertise to strengthen and expand the U.S. electric grid. NGV brings decades of experience partnering with regulators and local stakeholders to build energy infrastructure that supports economic growth, improves reliability, and helps deliver lower cost energy to customers.

About the Electricity Customer Alliance

The Electricity Customer Alliance is a coalition of energy consumers—including large commercial and industrial companies, consumer advocates, and public interest organizations—working to ensure that the U.S. electricity system evolves to meet the needs of a dynamic, digital economy. ECA advocates for transparent governance, modern infrastructure, and customer-focused policy reforms that enhance grid reliability, support economic growth, and lower energy costs.

About Converge Strategies

Converge Strategies, LLC provides consulting services focused on the intersection of energy resilience and national security. We find new ways to keep the lights on, no matter what happens.  

SOURCE National Grid

21%

more press release views with 

Request a Demo
Class (B2B/B2C)
B2B
Ingest Status
Need Review
Dedupe hash
66c431c1502ab0d61cc22e6c58a1c55f
Press Eligible
Yes
Press Eligible Reason
QA FAIL (need review): TARGET claims defense and military sites rely on commercial electric infrastructure 'with no independent backup,' but the SOURCE does not state this; it only says they depend on the commercial grid and that interregional transmission provides critical backup capability during emergencies.
Source Name
Unknown Company
Original Summary

<p>National Grid, the Electricity Customer Alliance and Converge Strategies partner with S&amp;P Global to analyze four major U.S. regions and identify transmission as the most cost-effective tool for meeting rising demand from AI, manufacturing and economic growth. The study finds that when...</p>

Image URL
https://mmx.prnewswire.com/media/MS1154173/National-Grid-Logo.jpg?id=OA2920554&p=facebook
AWS Public Sector Blog Highlights PDFix's Role in ITHAKA's On-Demand PDF Accessibility Pipeline
Image File
Original HTML

AWS Public Sector Blog Highlights PDFix's Role in ITHAKA's On-Demand PDF Accessibility Pipeline

NEWS PROVIDED BY

PDFix-US LLC

Sep 01, 2026, 10:00 ET

SHARE THIS ARTICLE

AWS Public Sector Blog highlights how PDFix structural tagging helped ITHAKA achieve a reported 98% accessibility check pass rate while reducing remediation costs by more than 97%

FREDERICK, Md., Sept. 1, 2026 /PRNewswire/ -- PDFix-US today highlighted a new AWS Public Sector Blog article detailing how ITHAKA, the nonprofit organization behind JSTOR, built an on-demand PDF accessibility remediation pipeline on Amazon Web Services (AWS) using PDFix for automated structural tagging.

ITHAKA provides researchers, students, and educators access to an extensive collection of scholarly content through platforms that include JSTOR. Its digital corpus encompasses approximately 20 million PDFs and 156 million pages, including materials dating back to 1550.

Scalable Digital Transformation

Remediating a collection of this size through conventional manual methods would present a significant financial and operational challenge. According to the AWS article, manual remediation of ITHAKA's full collection could cost between $156 million and $624 million.

Rather than attempting to remediate its entire archive in advance, ITHAKA worked with AWS to create an on-demand pipeline that processes documents as users request accessible versions. Each remediated PDF is then stored and made available for subsequent requests, allowing ITHAKA's accessible collection to grow organically based on actual user demand.

Within the pipeline, PDFix applies structural tagging—including headings, paragraphs, lists, and tables—to individual PDF pages. Amazon Bedrock generates alternative-text descriptions for images and charts, while AWS Step Functions orchestrates the processing workflow. The completed document is reassembled and evaluated against PDF/UA accessibility requirements using validation tools that include veraPDF.

Early Results Reported by AWS

A 98% accessibility check pass rate

An estimated processing cost of $0.026 per page

A cost reduction of more than 97% compared with manual remediation

Production deployment approximately two months after the initial AWS and ITHAKA workshop

"This implementation demonstrates what becomes possible when PDF accessibility is treated as a scalable technology and workflow challenge."

— David Herr, President, PDFix-US

ITHAKA combined PDFix with AWS services, artificial intelligence, validation tools, and appropriate human oversight to create a practical solution for an extraordinarily large and diverse document collection. It is an excellent example of how organizations can move beyond an exclusively manual approach and begin addressing accessibility at scale.

The architecture also incorporates a human-review fallback for documents that do not satisfy the required accessibility checks through automated processing. This combination of automation, validation, and human intervention allows ITHAKA to direct specialized remediation resources to documents that require them while processing many other documents efficiently.

Because the pipeline is modular, ITHAKA was able to adopt PDFix and veraPDF in place of the structural-tagging components used in the original open-source solution without rebuilding the complete architecture. The same modular approach will allow ITHAKA to evaluate and integrate new technologies as PDF accessibility and generative AI capabilities continue to evolve.

The AWS article presents the ITHAKA implementation as a replicable model for universities, libraries, government agencies, nonprofits, and other organizations managing large collections of inaccessible or untagged PDFs. It also demonstrates how PDFix can serve as the structural-tagging engine within cloud-based, enterprise, and on-premises document workflows.

"Organizations do not have to choose between an unsustainable manual-remediation expense and leaving large document collections inaccessible," Herr added. "PDFix gives developers and organizations the technology to build accessibility directly into scalable document-processing workflows while retaining validation and human review where they are needed."

Learn More

Read the complete AWS Public Sector Blog article: How ITHAKA built an on-demand PDF remediation pipeline on AWS

To learn how PDFix can support automated PDF tagging, batch processing, and integrated accessibility workflows, visit PDFix.net or contact PDFix-US to request a demonstration.

About PDFix-US

PDFix-US LLC is the exclusive U.S. distributor of PDFix software solutions for automated PDF accessibility, remediation, validation, and document-processing workflows. PDFix technology includes desktop applications for accessibility professionals and enterprise users, as well as developer tools that enable organizations to integrate PDF accessibility into cloud, server, desktop, and automated production environments.

PDFix solutions help government agencies, educational institutions, corporations, nonprofits, and technology providers address large document collections through scalable automation combined with human verification.

David Herr, President

PDFix-US LLC

PDFix.net

Trademark notice: Amazon Web Services, AWS, Amazon Bedrock, AWS Lambda, AWS Step Functions, AWS Fargate, Amazon EventBridge, and Amazon S3 are trademarks of Amazon.com, Inc. or its affiliates. JSTOR is a digital platform of ITHAKA. PDFix-US is not representing that AWS or ITHAKA endorses PDFix-US or this announcement.

Media Contact

David Herr, President

PDFix-US LLC

PDFix.net

SOURCE PDFix-US LLC

21%

more press release views with 

Request a Demo
Class (B2B/B2C)
B2B
Ingest Status
Rewritten
Dedupe hash
9fc4c32c16396fafbfd52d69332b2403
Press Eligible
Yes
Press Eligible Reason
Provides substantive information for technology and accessibility professionals about an AWS-based PDF remediation pipeline, automation, and enterprise document workflows.
Source Name
Unknown Company
Original Summary

<p>AWS Public Sector Blog highlights how PDFix structural tagging helped ITHAKA achieve a reported 98% accessibility check pass rate while reducing remediation costs by more than 97% FREDERICK, Md., Sept. 1, 2026 /PRNewswire/ -- PDFix-US today highlighted a new AWS Public Sector Blog article...</p>

Image URL
https://mmx.prnewswire.com/media/MS1978507/print-to-digital-transformation.jpg?id=OA2920759&p=facebook
HCSS names Ripley PR U.S. public relations agency of record
Image File
Original HTML

HCSS names Ripley PR U.S. public relations agency of record

NEWS PROVIDED BY

Ripley PR

Sep 01, 2026, 09:58 ET

SHARE THIS ARTICLE

Partnership will position HCSS experts at the forefront of conversations shaping construction technology, workforce and operations

KNOXVILLE, Tenn., Sept. 1, 2026 /PRNewswire/ -- HCSS, the leading provider of construction management software for the heavy civil and infrastructure construction industry, has selected Ripley PR as its public relations agency of record. Ripley PR is a Tennessee-based, award-winning public relations agency specializing in skilled trades and construction technology.

HCSS provides construction management software for heavy civil and infrastructure contractors, with HeavyBid, HeavyJob and HCSS Fleet on one connected platform to streamline estimating, field operations, and fleet management. Since 1986, the company has helped contractors improve productivity, control costs, and make better decisions across the project lifecycle through customer-driven technology and 24/7/365 support.

"HCSS has spent 40 years earning the trust of the heavy civil and infrastructure construction industry, and this next chapter gives us an opportunity to bring more of that expertise into the broader conversations shaping construction," said Casey Novak, vice president of marketing at HCSS. "As we enter this next chapter of growth and innovation, we want to be more intentional about sharing the perspectives of our people, our customers and the industry we serve. Ripley brings the construction knowledge and earned media expertise to help us expand the reach of those stories."

In July 2026, HCSS joined the Nemetschek Group's Build & Construct segment, expanding the company's global reach and creating new opportunities for innovation and collaboration across the construction lifecycle.

Ripley PR works with B2B tech and other clients as a strategic partner, elevating clients' industry presence by securing substantive earned media coverage, high-profile interview opportunities and impactful bylined thought leadership through its strong relationships with key trade publications and industry-relevant associations. More than just a full-service communications partner, the agency delivers robust, transparent reporting to align media success with business growth and prove the tangible value of public relations.

"HCSS understands heavy civil construction at a level few technology companies can match," said Heather Ripley, founder and CEO of Ripley PR. "Our job is to bring that expertise forward, sharing their unique perspectives and delivering insights that matter to the industry while positioning HCSS leaders as go-to resources for journalists covering construction, infrastructure and technology."

To learn more about HCSS, visit hcss.com.

Founded in 2013, Ripley PR has been named one of America's Best PR Agencies by Forbes and Newsweek and a Top Franchise Supplier by Entrepreneur Magazine. Additionally, Ripley PR is a two-time PR Agency of the Year in the Corporate LiveWire Prestige Awards. To learn more about Ripley PR, visit ripleypr.com.

About HCSS

HCSS is the leading provider of construction management software for heavy civil and infrastructure projects. Since 1986, HCSS has helped contractors work smarter, faster, and safer with innovative software designed hand-in-hand with the people who use it. What began with HeavyBid, the industry standard in estimating, has grown into a powerful, user-friendly platform spanning the entire project lifecycle. The HCSS platform - HeavyBid, HeavyJob, and HCSS Fleet - centralizes data across the office, field, and shop to deliver real-time insights and streamlined workflows so contractors can bid, build, and deliver with confidence. Recognized as both a pioneer and an industry leader, HCSS continues to innovate with customer-centric solutions and award-winning 24/7/365 support.

About Ripley PR

Ripley PR is an elite, global B2B public relations agency specializing in home service and building trades, manufacturing and franchising. The agency has been recognized by Newsweek as one of America's Top PR Agencies (2024), by the Corporate Livewire Prestige Awards as PR Agency of the Year (2025-2026) and by the Merit Awards as Best Communications/PR Agency (2025). Offering a full range of strategic communication services, including award recognition, crisis management and media relations, Ripley PR uses a blend of strategic business acumen and creative public relations branding to tell compelling stories and deliver measurable results.

Ripley PR is also a member of The Worldcom Public Relations Group, the world's leading partnership of independently owned PR agencies with more than 110 offices and approximately 2,000 communications professionals across 45 countries on six continents. For more information, visit ripleypr.com.

SOURCE Ripley PR

21%

more press release views with 

Request a Demo

Class (B2B/B2C)
B2B
Ingest Status
Error
Dedupe hash
0b5d80d48fceb170e299048ac9208c1e
Press Eligible
No
Press Eligible Reason
Text too short (285)
Source Name
Unknown Company
Original Summary

<p>Partnership will position HCSS experts at the forefront of conversations shaping construction technology, workforce and operations KNOXVILLE, Tenn., Sept. 1, 2026 /PRNewswire/ -- HCSS, the leading provider of construction management software for the heavy civil and infrastructure...</p>

Image URL
https://mmx.prnewswire.com/media/MS1773964/Ripley-PR-logo-image.jpg?id=OA2923234&p=facebook
AgriCapture Partners with Google to Advance Water Stewardship in Texas
Original HTML

AgriCapture Partners with Google to Advance Water Stewardship in Texas

NEWS PROVIDED BY

AgriCapture

Sep 01, 2026, 09:59 ET

SHARE THIS ARTICLE

Multi-year partnership will transition 6,000 acres of rice farmland in the Trinity River Basin to water-saving irrigation practices, delivering over 5.4 billion gallons of water benefit

NASHVILLE, Tenn., Sept. 1, 2026 /PRNewswire/ -- AgriCapture today announced a new partnership with Google and the Bonneville Environmental Foundation (BEF) to replenish 5.4 billion gallons of water in Southeast Texas. The program will bring water-saving irrigation infrastructure to 6,000 acres of rice farmland, reducing irrigation withdrawals in one of the most stressed watersheds in the state.

Globally, rice provides roughly one-fifth of all calories consumed by humans, more than any other single food crop, but that scale comes with a water footprint of over 170 gallons per single pound of finished rice. In Texas, roughly 140,000 rice acres are flood irrigated each year within the Trinity River Basin, a watershed under pressure from agricultural demand, urban growth, and recurring drought.

AgriCapture is partnering directly with Texas rice farmers to improve irrigation systems that optimize water use throughout the growing season and enable farmers to transition away from continuous flooding. Irrigation is measured throughout the project to quantify water savings using flow meters, field sensors, and geospatial monitoring. AgriCapture then quantifies the annual volumetric water benefit of the improved irrigation systems compared to the previous flood irrigation to generate verified volumetric water benefits.

Google is financing the transition, providing the upfront capital investment behind the irrigation infrastructure as well as performance-based financial benefits to farmers for the water they save. Google's investment is part of a broader commitment to responsibly manage water resources in the communities where it builds and operates data centers.

"This partnership shows what's possible when smart technology and strong partners come together to strengthen agriculture," said Tyler Hull, CEO of AgriCapture. "Google is financing system-level change. Improved irrigation infrastructure paired with economic incentives to farmers supports the Texas rice industry while returning 5.4 billion gallons of water to the community watershed."

Scaling water stewardship across Texas and beyond

The Texas rice program adds to AgriCapture's growing portfolio of water stewardship and carbon projects across six states in the U.S. and internationally in Brazil, Argentina, India, Pakistan, Indonesia, Thailand, Cambodia, Laos, and the Philippines. Globally, Google has committed over $500 million to water, wastewater, and water reuse infrastructure and now supports 165 water stewardship projects across 97 watersheds. AgriCapture is on a mission to deliver cost-effective water solutions that are community-focused and globally scalable. 

About AgriCapture

AgriCapture is a leading developer of agricultural sustainability solutions and a trusted partner to companies seeking durable, nature-based emission reductions and water stewardship outcomes. AgriCapture's digital asset platform and MRV enable farmers to monetize sustainable land and irrigation management practices by generating high-integrity environmental assets. AgriCapture's carbon and water programs support over 400,000 acres across 10 countries to generate water savings and methane reductions on behalf of Fortune 500 companies across the technology, food and beverage, and financial services industries.

SOURCE AgriCapture

21%

more press release views with 

Request a Demo

Class (B2B/B2C)
B2B
Ingest Status
Rewritten
Dedupe hash
603f6f2128090228030c07312dc97856
Press Eligible
Yes
Press Eligible Reason
Reports a substantive agriculture and environmental sustainability partnership involving irrigation technology, water stewardship financing, and farmers.
Source Name
Unknown Company
Original Summary

<p>Multi-year partnership will transition 6,000 acres of rice farmland in the Trinity River Basin to water-saving irrigation practices, delivering over 5.4 billion gallons of water benefit NASHVILLE, Tenn., Sept. 1, 2026 /PRNewswire/ -- AgriCapture today announced a new partnership with...</p>

ISCO and ODC Announce Strategic Partnership to Build Jammer-Resilient AI-RAN for Mission-Critical Wireless Networks
Image File
Original HTML

ISCO and ODC Announce Strategic Partnership to Build Jammer-Resilient AI-RAN for Mission-Critical Wireless Networks

NEWS PROVIDED BY

ISCO International

Sep 01, 2026, 09:00 ET

SHARE THIS ARTICLE

Collaboration integrates ISCO's IMC jammer cancellation into ODC's RANIQ platform, enabling a more resilient and spectrum Intelligent AI-RAN

CHICAGO, Sept. 1, 2026 /PRNewswire/ -- ISCO International, a leader in wireless interference cancellation technology, and ORAN Development Company (ODC), a pioneer in AI-Native Radio Access Networks (AI-RAN), announce a strategic partnership to integrate ISCO's anti-jammer technology into ODC's AI-RAN architecture.

At the core of the collaboration is ODC's RANIQ platform, which enables native intelligence at the radio edge and provides the runtime foundation for deploying ISCO's Interference Management and Cancellation (IMC) software. ISCO's IMC software is structured using a "dApp-like" architecture. Using the real-time RF IQ data available from RANIQ, ISCO's IMC technology can deliver real-time Layer-1 jammer resiliency and interference mitigation improving coverage, network accessibility and throughput.

This initiative aligns with industry efforts to accelerate AI-driven wireless infrastructure and next-generation 5G/6G innovation, positioning ISCO and ODC at the forefront of intelligent, software-defined network development. Together, the companies are embracing open architectures to bring to customers a more secure, resilient wireless network to more reliably support mission-critical wireless applications. By embedding interference management directly into the radio access network, new intelligence can leverage advanced computing and machine learning technologies to enable advanced network optimization techniques to improve network performance, resiliency and spectral efficiency of the wireless network.

"Our partnership with ODC represents an important step toward strengthening resiliency and survivability of mission-critical wireless networks" said Gordon Reichard, CEO of ISCO. "As the wireless environment becomes increasingly contested and electronically challenged, the network infrastructure must be designed to maintain connectivity and operational integrity under real-world interference and jamming conditions. By integrating ISCO's IMC capabilities into ODC's AI-RAN ecosystem, we are helping advance secure, intelligent and resilient wireless infrastructure essential to national security, defense and critical infrastructure."

"We are excited to partner with ISCO to bring advanced, proven interference cancellation directly into the AI-RAN platform," said Srinivas Gudlandana, CEO of ODC. "This partnership enables a new level of robustness for wireless networks, ensuring connectivity in the most demanding conditions. Together, we are delivering an AI-based solution for critical infrastructure, national security, and the future of resilient connectivity."

ISCO and ODC's joint development to embed IMC anti-jammer software technology directly into the RANIQ stack is a commitment by the companies to build security and resilience into the wireless network.

About ISCO

ISCO International is the leading U.S. technology company focused on wireless interference management software and solutions, helping to ensure that mobile networks and mission-critical private 5G / LTE networks perform as planned. ISCO's patented technology that detects, analyzes and mitigates jammers and interference, is field-proven, with deployments in Tier 1 wireless networks across the U.S. For more information, visit www.iscointl.com.

About ODC

ODC is a leader in AI-Native Radio Access Network ("AI-RAN") technology and the architect of the U.S.-based Odyssey software platform. By integrating advanced AI sensing and inference into the RAN, ODC enables telecommunications providers to unlock new revenue streams and mission-critical capabilities across the industrial, commercial, and public sectors. More information at www.orandevco.com.

SOURCE ISCO International

21%

more press release views with 

Request a Demo

Class (B2B/B2C)
B2B
Ingest Status
Error
Dedupe hash
89a1c1793cbea0a348189feac2d287fe
Press Eligible
No
Press Eligible Reason
Text too short (282)
Source Name
Unknown Company
Original Summary

<p>Collaboration integrates ISCO's IMC jammer cancellation into ODC's RANIQ platform, enabling a more resilient and spectrum Intelligent AI-RAN CHICAGO, Sept. 1, 2026 /PRNewswire/ -- ISCO International, a leader in wireless interference cancellation technology, and ORAN Development Company...</p>

Image URL
https://mmx.prnewswire.com/media/MS1795125/ISCO-Logo.jpg?id=OA2920813&p=facebook
TANK 5 Pro de 8849 incorpora imágenes térmicas ultraanchas y proyección 2K a un robusto dispositivo insignia
Image File
Original HTML

TANK 5 Pro de 8849 incorpora imágenes térmicas ultraanchas y proyección 2K a un robusto dispositivo insignia USA - español

NEWS PROVIDED BY

8849

Sep 01, 2026, 09:00 ET

SHARE THIS ARTICLE

SHENZHEN, China, 1 de septiembre de 2026 /PRNewswire/ -- El nuevo TANK 5 Pro combina imágenes térmicas ultraanchas, un proyector DLP 2K integrado y un rendimiento de gama alta, todo ello dentro de un smartphone resistente diseñado para entornos exteriores y profesionales exigentes.

Imágenes térmicas FLIR® Lepton 3.1R - 95 ° Ultra ancho

Equipada con un sensor FLIR® Lepton 3.1R con resolución de 160 × 120, su amplio campo de visión sirve para permitir a los usuarios identificar fuentes de calor y anomalías de temperatura dentro de un área mayor de forma simultánea, lo que la hace útil para la exploración al aire libre, la revisión de equipos, las inspecciones estructurales, las operaciones de búsqueda y rescate y la navegación nocturna.

Proyector DLP 2K de 220 lúmenes con enfoque automático

Proporciona imágenes proyectadas nítidas en 2K con 220 lúmenes. El enfoque automático integrado sirve para ajustarse con rapidez a diferentes distancias. Abarcando desde la visualización de datos térmicos en el campo hasta la difusión de presentaciones, mapas, vídeos y otros contenidos, el proyector integrado añade una segunda herramienta visual sin necesidad de tener que disponer de equipo adicional.

Dimensity 9400e 5G, WiFi 7 y Android 16

Equipado con el chipset MediaTek Dimensity 9400e 5G de 4 nm con soporte para Wi-Fi 7, TANK 5 Pro está diseñado para su uso en aplicaciones exigentes, conectividad de alta velocidad, juegos y multitarea. Contando con Android 16, el dispositivo proporciona una experiencia de software moderna y optimizada.

Pantalla AMOLED 3K de 6,73" a 3.000 nits

Gracias a su brillo máximo de hasta 3.000 nits, la pantalla AMOLED 3K de 6,73 pulgadas está diseñada para mantener una elevada visibilidad en condiciones exteriores luminosas, por lo que se convierte en ideal para su uso en navegación, contenido multimedia y uso en exteriores.

17.600 mAh + carga de 120 W

La batería de 17.600 mAh se ha diseñado para un uso prolongado en situaciones donde el acceso a la energía puede ser limitado. Combinada con la carga rápida de 120 W, todo ello ayuda a reducir el tiempo de inactividad cuando la batería necesita recargarse.

18 GB de RAM + 512 GB de almacenamiento ROM

Con 18 GB de RAM y 512 GB de almacenamiento, TANK 5 Pro proporciona una amplia capacidad para la multitarea, archivos grandes, juegos, datos de imágenes térmicas y vídeo de alta resolución.

Conectividad global eSIM

Gracias a su compatibilidad con eSIM, los usuarios pueden cambiar de planes móviles compatibles sin depender únicamente de una tarjeta SIM física, lo que añade flexibilidad para viajes y uso internacional.

Disponibilidad

TANK 5 Pro ya está disponible para pre-pedido en 8849tech.com. Manténgase atento si desea recibir más actualizaciones.

Acerca de 8849

8849 se dedica al desarrollo de dispositivos móviles robustos e innovadores que combinan durabilidad, rendimiento y resistencia, lo que permite a los usuarios mantenerse conectados y productivos en cualquier entorno.

Información de contacto

Página web: 8849tech.com

E-mail: support@8849tech.com

Teléfono: +86 18676755187

21%

more press release views with 

Request a Demo

Class (B2B/B2C)
B2C
Ingest Status
Rewritten
Dedupe hash
3b8cb65bfb39537cb700b6977a833095
Press Eligible
Yes
Press Eligible Reason
An informative product launch for a rugged smartphone, primarily aimed at consumers interested in technology and consumer electronics.
Source Name
Unknown Company
Original Summary

<p>SHENZHEN, China, 1 de septiembre de 2026 /PRNewswire/ -- El nuevo TANK 5 Pro combina imágenes térmicas ultraanchas, un proyector DLP 2K integrado y un rendimiento de gama alta, todo ello dentro de un smartphone resistente diseñado para entornos exteriores y profesionales exigentes....</p>

Image URL
https://i.ytimg.com/vi/W1GXHEHPKFI/hqdefault.jpg
Crunch Franchise Brings Next-Generation Fitness Experience to Rockledge, Florida
Image File
Original HTML

Crunch Franchise Brings Next-Generation Fitness Experience to Rockledge, Florida

NEWS PROVIDED BY

Crunch Fitness

Sep 01, 2026, 09:00 ET

SHARE THIS ARTICLE

Crunch at Viera will feature the innovative Crunch 3.0 design for an elevated gym-goer experience

ROCKLEDGE, Fla., Sept. 1, 2026 /PRNewswire/ -- Crunch Fitness today announced the upcoming opening of Crunch at Viera in Rockledge, Florida. The $5 million, approximately 43,000-square-foot state-of-the-art fitness facility will open its doors soon, with pre-sale now underway. Operated by Crunch Fitness franchisee CR Fitness Holdings, LLC, a subsidiary of CR Fitness Holdings, Crunch at Viera will be located at 5410 Murrell Road, Suite 135, creating a new fitness offering for residents of the Rockledge area.

Crunch at Viera will feature the new Crunch 3.0 design, combining modern aesthetics, expanded training spaces, and enhanced functionality with some of Crunch's newest fitness offerings, including a dedicated Abs & Glutes Room and a Crunch Reform Pilates™ Studio for members looking for more targeted, results-driven programming.

Crunch Reform Pilates™ studios feature integrated lighting and sound systems, reformer machines, and digital programming screens. Crunch Reform Pilates™ classes blend hands-on, instructor-led training with integrated virtual guidance, delivering a modernized Pilates offering built for today's fitness. The Abs & Glutes Room provides a dedicated space for core and lower-body training, featuring specialized equipment and accessories to improve workout flow and give members a focused environment for targeted training.

Fusing fitness with entertainment to make serious exercise fun, Crunch at Viera will also offer:

Power half-hour circuit training

Personal training

Dedicated group fitness studio

Olympic lifting platforms

Hot Studio

Abs & Glutes Room

Crunch Reform Pilates™

Advanced HIIT classes

TRX®

Functional HIITZone™ training area with indoor turf

Stretching Zone

Tanning

Relax & Recover® — Contrast Therapy (Frost Locker and Infrared Sauna), Human Touch Massage Chairs, CryoLounge, and HydroMassage® beds

Full-service locker rooms with a dry sauna

CR Fitness Holdings, LLC, a subsidiary of CR Fitness Holdings, currently operates 63 Crunch gyms in the state of Florida and is projected to be operating 65 Crunch clubs statewide by the time Crunch at Viera opens. Its parent company, CR Fitness Holdings, is a leading Crunch Fitness franchisee that serves over one million members and is on pace to operate 110 Crunch locations nationwide across Florida, Georgia, Texas, North Carolina, Arizona, and Tennessee by the end of 2026. Backed by major investment firms North Castle Partners and Sixth Street, CR Fitness Holdings is continuing its expansion across Florida, with additional locations planned in the near future.

"We are excited to be announcing the plans for Crunch at Viera and offering a premium, fun fitness option to the communities of Viera and Rockledge at an affordable price," said Tony Scrimale, CEO of CR Fitness Holdings.

Prospective members can visit CrunchViera.com for more information about memberships and to reserve their rate. Crunch at Viera is offering discounted memberships beginning at $9.99 per month, with $0 enrollment fees and additional savings on select membership options. The first 500 founding members will receive a free t-shirt, exclusive discounts on small group and personal training, and more.

This new club opening will bring over 70 career opportunities to the Rockledge community across Personal Training, Group Fitness, Sales, Operations, and more. For more information, please visit www.Crunch.com.

Crunch was ranked #2 in the fitness category and #20 overall in the annual Entrepreneur Franchise 500®, up from #32 last year in the world's most comprehensive franchise ranking. The brand has appeared on the list for 13 consecutive years and was inducted into the 2026 Hall of Fame and Consecutive Ranking Club. Crunch was also recognized on the annual Inc. 5000 list of America's fastest-growing companies. It continues to expand nationwide and push the bar with innovative offerings for its members.

About CR Fitness Holdings, LLC:

CR Fitness Holdings LLC, a subsidiary of CR Fitness Holdings, currently operates 63 Crunch gyms in the state of Florida and is on track to operate nearly 65 total by the end of 2026. Its parent company, CR Fitness Holdings, is a leading Crunch Fitness franchise group that currently serves over one million members across 96 Crunch Fitness locations.

About Crunch:

Crunch is a gym that believes in making serious exercise fun by fusing fitness and entertainment and pioneering a philosophy of 'No Judgments.' Crunch serves a fitness community for all kinds of people with all types of goals, exercising all different ways, working it out at the same place together. Today, we are renowned for creating one-of-a-kind group fitness classes and unique programming for our wildly diverse members. Headquartered in New York City, Crunch serves 4 million members with over 585 gyms worldwide in 41 states, the District of Columbia, Australia, Canada, Costa Rica, Puerto Rico, and India. Crunch is rapidly expanding across the U.S. and around the globe.

SOURCE Crunch Fitness

21%

more press release views with 

Request a Demo

Class (B2B/B2C)
B2C
Ingest Status
Rewritten
Dedupe hash
85752c2cb739ddff4a1ae2b45041b421
Press Eligible
Yes
Press Eligible Reason
Reports the opening of a new fitness facility, its amenities, memberships, and local employment opportunities, primarily relevant to consumers interested in sports and leisure.
Source Name
Unknown Company
Original Summary

<p>Crunch at Viera will feature the innovative Crunch 3.0 design for an elevated gym-goer experience ROCKLEDGE, Fla., Sept. 1, 2026 /PRNewswire/ -- Crunch Fitness today announced the upcoming opening of Crunch at Viera in Rockledge, Florida. The $5 million, approximately 43,000-square-foot...</p>

Image URL
https://mmx.prnewswire.com/media/MS254659/CRUNCH-FITNESS-LOGO.jpg?id=OA2921815&p=facebook